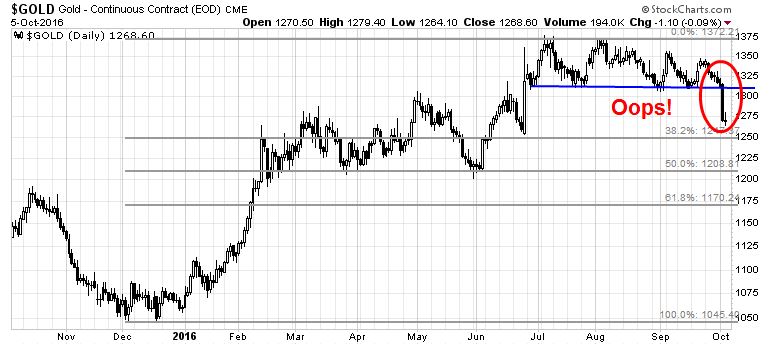
Mid-week market update: The market gods must be angry. Just as a goldbug predicted the demise of the US Dollar (and therefore the rise of gold) as of September 30, 2016 at 4pm ET, the USD rallied and gold cratered on Tuesday. The technical damage to gold was extensive, as it broke a key support level at 1300, though it did stabilize today.
I have had a number of questions about the outlook for gold in the past. My reply has always been the same. Don`t ask me about gold, ask about the US Dollar. Consider this chart of stated gold reserves. Assuming that the conspiracy theorists are wrong and the United States has all the gold it says it has, the market value of US gold reserves at $1300 per oz comes to roughly $340 billion. That`s not even a single year`s fiscal deficit!
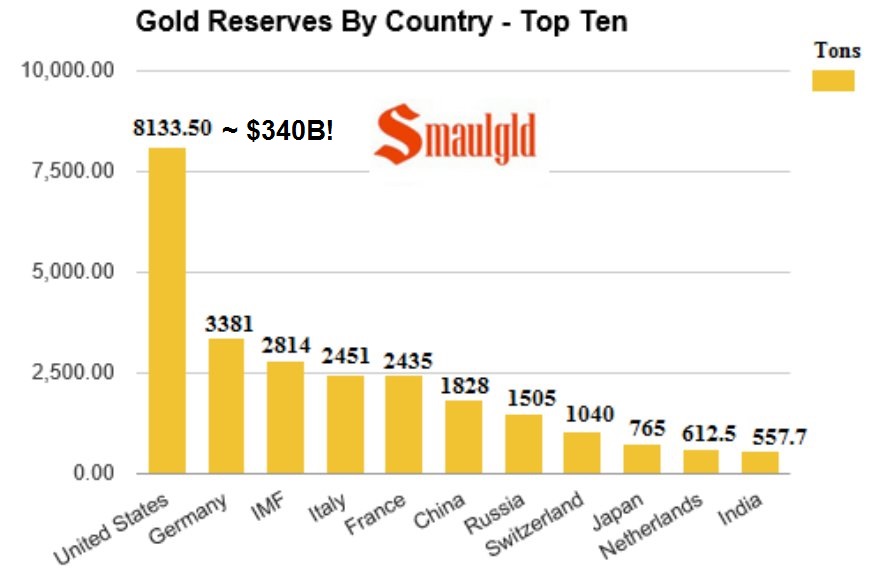
The global holdings of US Treasury paper dwarfs precious metal holdings. From a portfolio viewpoint, gold cannot be anything but a miniscule weight in the aggregate holdings of a global portfolio. As the gold price is inversely correlated to the greenback, it makes sense to analyze the more liquid asset class, namely the USD.
Will the real USD Index please stand up?
The USD is just a single currency, measured against the currencies of other countries in the world. So how do we measure the USD? As the chart below shows, the technical picture of the Broad Trade Weighted Dollar indicates that it is range-bound.
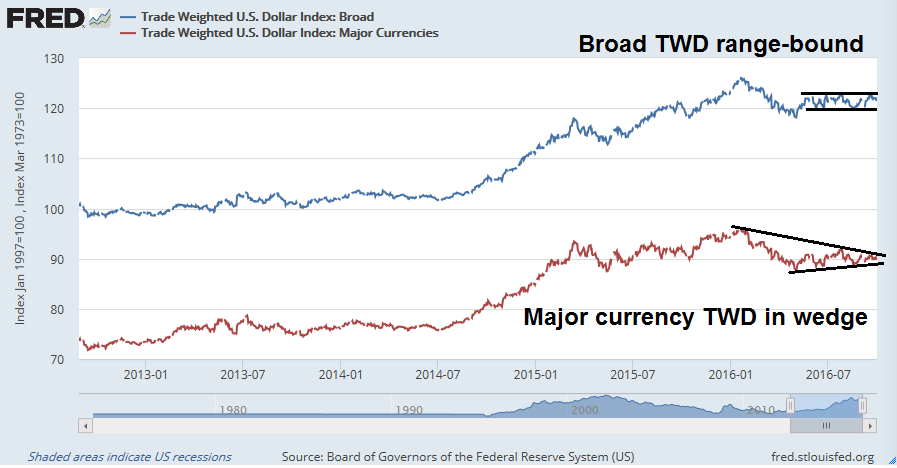
By contrast, the Major Currency TWD is trading in a narrow wedge, which is also the pattern shown by the popularly used USD Index, DXY.
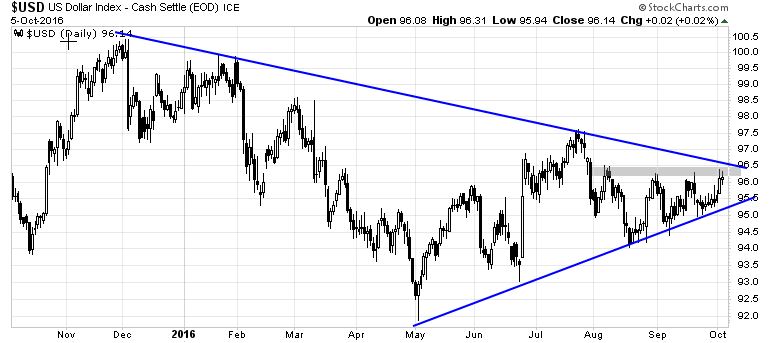
From a technical perspective, these charts of the USD doesn’t give us a lot of clue about the intermediate term direction of the currency. We need to see a definitive breakout before making a call on the USD, gold, and other commodity prices. In addition, an upside USD breakout may have bearish implications for equity prices, as greenback strength will have the effect of squeezing the operating margins of large cap companies operating overseas.
Signs of global reflation
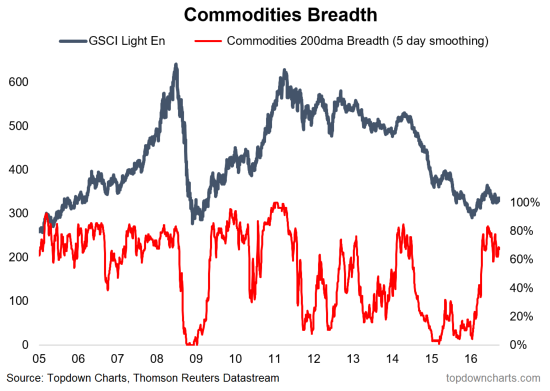
However, there may be some hopeful clues for gold bulls. Gold is believed to be an inflation hedge and inflation may be on the verge of a comeback. Callum Thomas recently observed positive breadth patterns in commodity prices, which is bullish for the entire commodity complex, including gold.
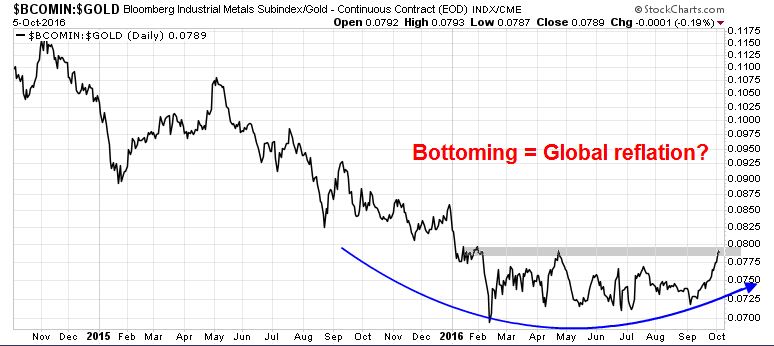
In addition, the ratio of industrial metals to gold is tracing out a bottoming pattern. This suggests that the cyclically sensitive element in commodity prices, net of the inflationary hedge component, is signalling the return of global economic growth. Rising growth will eventually translate to higher inflationary pressures.
Short term gold bearish
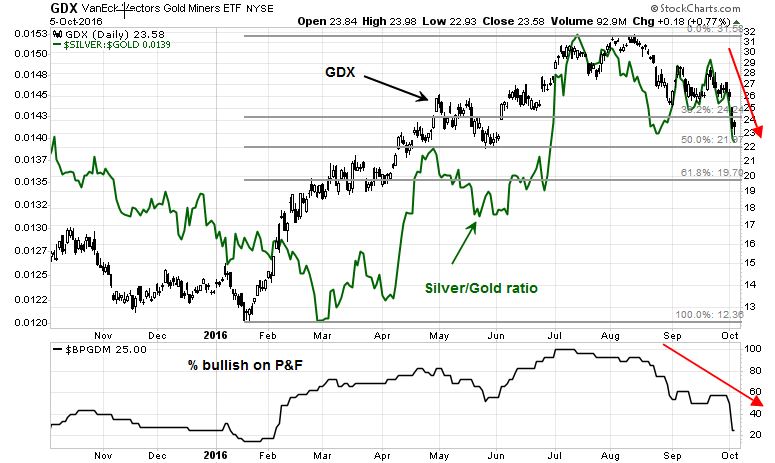
In the short term, however, breadth metrics in the precious metal complex appear to be bearish. The ratio of high beta silver to gold (green line) is tanking. The % bullish measure is also tanking and confirming the weakness in gold. This trading pattern suggests that gold prices need to stabilize and find a bottom before it can sustainably rise again. The first area of support can be found at the 50% Fibonacci retracement level at about $22.
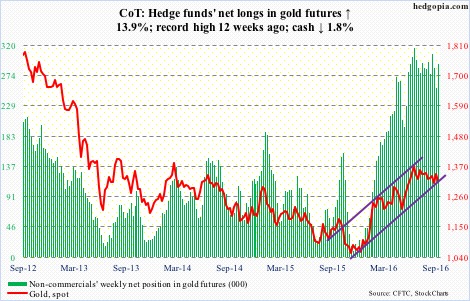
As well, sentiment doesn’t seem to be sufficiently washed out to form a durable bottom. My social media feed is still full of hopeful bulls. This chart from Hedgopia shows that large speculators, or hedge funds, have not reversed out of their crowded long positions yet.
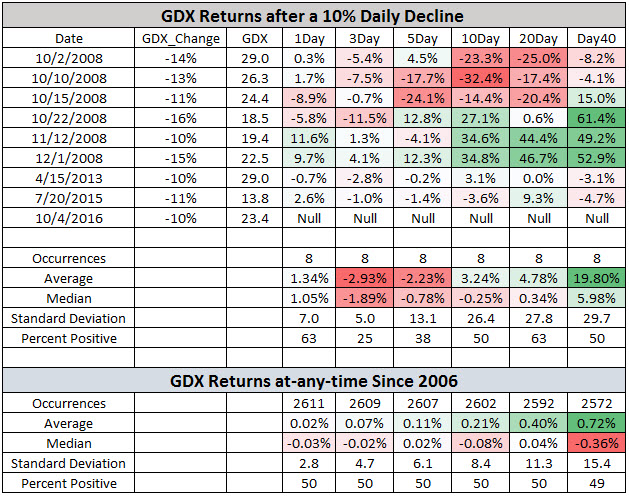
Historical studies, like this one from Schaeffer’s Research, point to more short term pain first before a rally can occur.
Bottom line: It’s too early to buy yet, but stay tuned!
The day of the decline, the news media reported that Indian gold imports were down 43% YOY. Very significant negative that could have increased downward pressure on the price of bullion.
http://in.reuters.com/article/india-gold-imports-idINKCN1230XH
Hi Cam,
Do you have any specific comments on the effect of higher interest rates on gold ?
Presumably as inflation increases then interest rates will go up causing the the Dollar to go up which is bad for gold in the long term ?
Thanks for all your insights.
Historically, gold has been affected by real (inflation adjusted) interest rates. Low real rates are bullish for gold and rising real rates are bearish.
In almost all cases commodities move in tandem. If you look at the long term chart of DBC, a commodities tracking etf the lows were made in late January 2016. Therefore, it would be extremely unusual for gold to go into its own private bear market. I am working on the assumption that this is a sharp correction in an on going bull market. The support is at 1250 and then major support at 1200. The time to add to positions is when you have sharp corrections against the major trend. In the stock market it was in February of 2016 when Cam correctly called the bottom.
Long term Interest rates on the other hand have seen their low in yields. One needs to look at Utility Index or the Dow Jones Real Estate Index to see the carnage. The declines have “wiped out” years of stable dividend income and the bear market has started.
Rising long term rates and higher commodity prices with anemic growth in the world is a prescription for stagflation. Larry Summers might be right! In any case, these are serious head winds for the equity market. We might be at an important juncture.
I am working on the thesis that there is going to be a serious dislocation in the European Banks which causes a “give up” in the Bond Market. A flight to the dollar and gold as a safe haven.