Maybe it’s me, or my imagination? Even before the latest round of market weakness, most of the feedback and sentiment on my social media feed has tended to bear bearish. I saw a fair number of calls for SPX to eventually test its February lows at about 1820, but I haven’t seen a lot of forecasts for breakouts to new highs. The recent year-end projection by respected former Value Line research director Sam Eisenstadt of 2220 only represents only modest upside from current levels, but I don’t see a lot of enthusiasm for that call.
The WSJ recently call this The Most Pessimistic Bull Market in History, as investors have only embraced it in the most reluctant way:
Instead of chasing growth and profits, investors this year have bought into safety—in a big way. Only two of the 10 top-level sectors which make up the market have reached new highs this year, and they are the antithesis of exuberance: utilities and consumer staples.
This may be merely a failure of imagination. As in 2007, the bubble pushing up the market may be elsewhere. Back then, valuations weren’t outrageous, but excess in credit created unsustainable profits. This time the most obvious froth is in the government-bond markets. German 10-year bunds on Friday yielded a mere €270 a year on a €1 million investment ($1.1 million), enough to fuel your BMW 7-Series a couple of times with enough left over for a currywurst and a beer. Japan’s yields are negative for bonds maturing out to early 2031, while U.S. 10-year Treasurys on Monday closed at a new 52-week low.
Josh Brown also pointed out that stock market investors have become chicken-bulls (my term, not his), as the two most popular ETFs for equity flows have been low-volatility funds, USMV and SPLV:
The popularity of these two ETFs is perfectly emblematic of the mood these days among financial advisors and their clients. And if you know anyone in the ETF business, they’ll tell you that the principal determiners of flows are in this order: 1) recent performance 2) whether or not advisors have been sold on them and 3) recent performance. ETFs do not sell themselves and retail do-it-yourselfers are not the drivers of AUM flows – only advisors can really move the ETF needle. The iShares product probably has an edge on SPLV because it’s based on an MSCI index, which is what many advisors use as a benchmark in their performance reporting.
That’s where the “chicken-bull” part comes in:
A collective financial advisor decision was made in the aftermath of August – “Okay, we’ll stay in, but we can’t take the full volatility of the stock market anymore.”
You can only imagine the calls that were coming in – “Is this it? Here we go again!”
To which the advisors’ response was something along the lines of “Don’t worry, I have an idea…” The iShares and PowerShares wholesalers did their work well.
Seeing this fund grow to $12.5 billion, having taken in a third of that in the first four months of this year, tells you everything you need to know about current sentiment. Advisors are tacitly accepting that they must be in US stocks, but because of the angst of their clients, they’re offering them exposure through a vehicle that purports to offer “minimum” volatility.
That’s not the sort of investor behavior and psychology that happens at market tops. While a bull case where the SPX rises to 2400-2500 is my base case scenario, it is well within my range of possibilities. Until the investing public starts to get wildly enthusiastic about a 2400-2500 SPX target, it’s hard to see how this market tops out.
Let me make two cases for a 2400-2500 bull market. One is fundamental, the other is technical.
The valuation bull case
An analysis by Calamos Investments recently made the point that the stock market isn’t very overvalued. They compared the forward P/E ratio of the market and market sectors in 1992 and today. 1992 was chosen because no one could argue that the market was overvalued then, as it was just the start of the great market run that culminated in the NASDAQ Bubble.
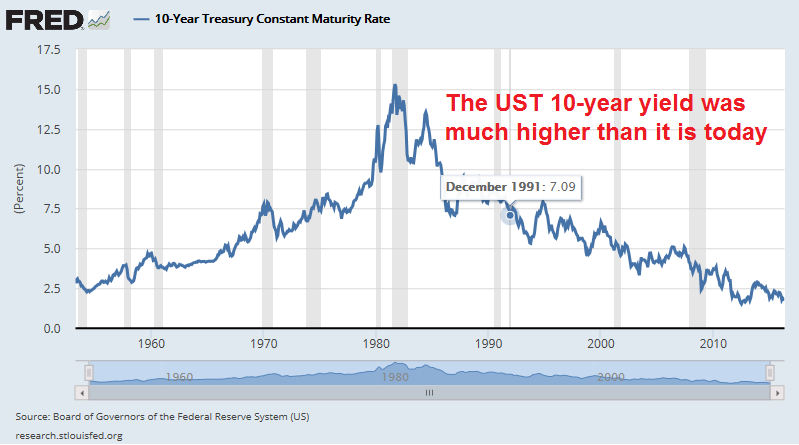
As you read this analysis, don’t forget that interest rates were considerably higher than they are today. Arguably, today’s low rate environment deserves a higher P/E multiple.
As the table below shows, the current market forward P/E multiple of 16.4 is modestly above the 1992 multiple of 14.3. An examination of the biggest differences in P/E multiples reveals that they are Energy, which is understandable because its earnings have been devastated by the oil crash, Consumer Staples and Utilities (annotations are mine).

Wait! What? Where are the excesses in this market? Staples and Utilities are defensive sectors. You mean that investors are paying up for defensive exposure (see the WSJ and Josh Brown above)?
In the past, market tops have been marked by wild bullishness about some hot sector, such as Financial, Technology, Gold, Energy and so on. Does a market led by defensive low-volatilaty leadership look like the psychology of a market top?
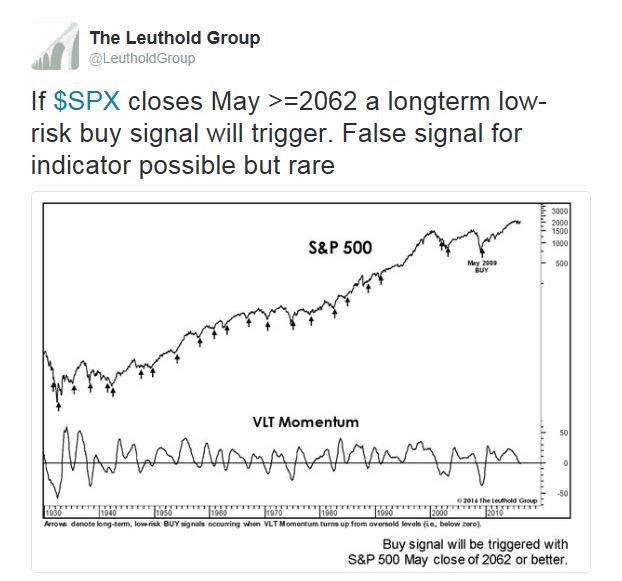
The VLT Momentum buy signal
The other bullish signal comes from the VLT Momentum Indicator, which is a momentum signal using long-term monthly data developed by Coppock. I am indebted to Leuthold Group who alerted me to the potential setup in May. Indeed, SPX closed above 2062 in May, which triggered a VLT Momentum Indicator buy signal.
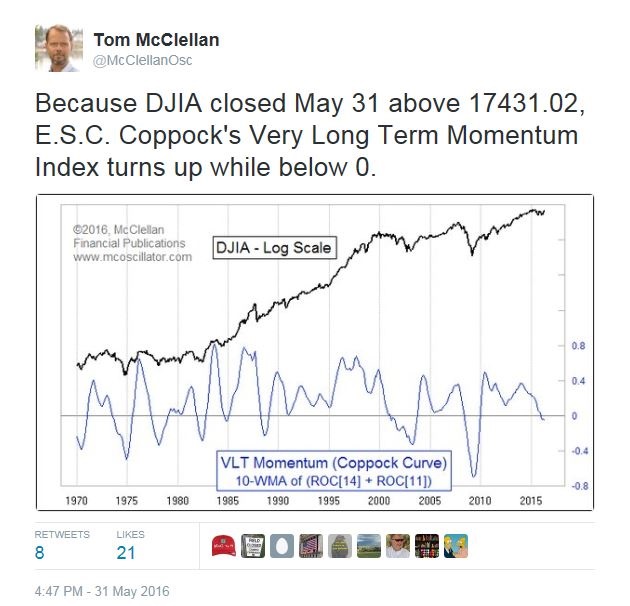
Tom McClellan also wrote about the buy signal, but based on the DJIA instead of SPX:
This Bloomberg story went into greater detail about the work by Leuthold Weeden Capital and outlined the past record of this buy signal.
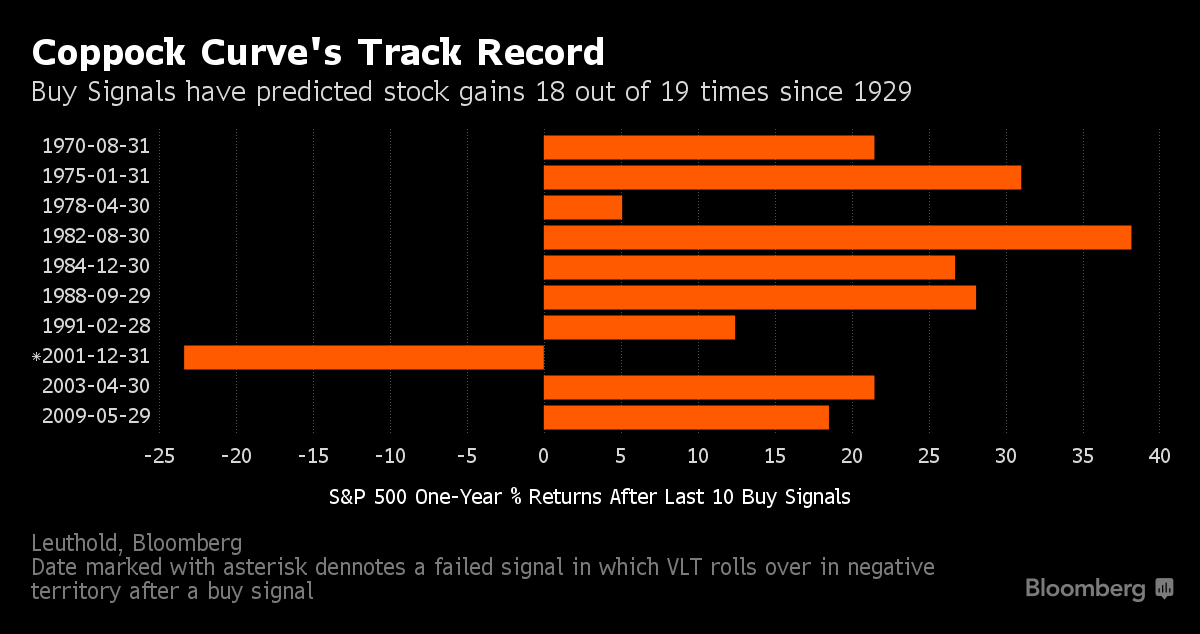
If history is any guide, a one-year SPX target of 2500 is well within reach using the median return of about 22% after past VLT Momentum Indicator buy signals. These days, a 2200 target would be considered mildly aggressive and price targets of 2500 is virtually unheard of.
In conclusion, market psychology is still overly bearish. Until I see more of the public getting more enthusiastic and piling into stocks with an eye towards 2400, 2500 or even talk about 3000, it’s hard to see how this market can make a cyclical top.
I believe we are in a new bull market, started a few months ago. A bull market goes up 50-75% over 3-4 years. Here is how this will happen.
Last year, Warren Buffett said the market was expensive if rates returned to normal but if rates were to stay low for 10 years it is ‘extremely cheap’ (his words). Plus he added in either case, stocks were cheaper than bonds. He, you and I thought that when the the Federal Reserve Board would take the lid off the current rates and start raising them, we would ramp up to ‘normal’ rates in short order. Normal is considered inflation (2% Fed target) plus 2% real return or 4%. Well the lid was taken off and instead of going up, bond rates dropped off a cliff. SURPRISE. Now, the investing public is rethinking the long term outlook for rates. I believe the phrase LOWER FOR LONGER will become a meme. Yesterday, Yellen confirmed that the Fed governors rate projections (Dot Plot) for the next few years has taken another sharp drop. It has dropped at every meeting in the last year. At every meeting in future that the Fed does nothing, the long term outlook will ratchet lower and LOWER FOR LONGER will gain momentum.
How does this change in thinking effect the stock market. It makes the current dividend yield of 2% extremely generous with 10 year Treasuries at 1.5%. If rates were heading for 4%, this yield would be ho-hum. Stocks normally yield a lot less than bonds. Twenty years ago for example, bonds yielded 7% when stocks yielded 2%. If the S&P 500 2% yield would match the current yield 1.5% of bonds, it would go up 25% in price. Plus, dividends are projected to grow 6% this year. That would add 6% to the annual stock gain for a total potential return of 31% as stocks reset to the new yield environment.
This all may seem impossible to experienced investors like us who subscribe to Cam’s great letter. We are used to valuing markets based on earnings growth and economic fundamentals. I deal with many Boomers who are in or close to retirement. I can tell you that investment income is a key focus and bonds can’t provide a decent income. They are not sophisticated. Those folks who reached for yield with junk bonds got their hands slapped. I am finding they like this idea of a dividend yield focus to boost incomes. The Canadian stock market yields an amazing 3% and we get a dividend tax credit that takes that yield up to a 4% equivalent. A Canadian dividend ETF yields an absurdly generous 4.5% (5.5% with the tax credit). I expect there will be an underlying shift of huge amounts of money from low yielding bond instruments to dividend ETFs that will stealthily push up markets. Those who focus on anemic earnings momentum or other previously successful methods will be confused as market indexes drift higher when the historic background indicators would not historically justify higher prices. For example, let’s say the economy has a flattish GNP quarter; great for ‘lower for longer’. Let’s say monthly retail sales disappoint; great for ‘lower for longer’. Let’s say Britain exits; great for ‘lower for longer’. Of course, if the economy starts running hot; VERY BAD for ‘lower for longer’.
That brings me to how ETFs will help this trend. A dividend ETF makes it easy to buy a predictable dividend income unit rather than individual stocks. Right now there is a buying binge on Low Volatility ETFs. People buy them on their factor concept. The same thing will happen to dividend ETFs but in a much bigger way since there is vastly more money invested in micro-low interest rate vehicles. The Select Dividend ETF (DVY) yields 4%. A slam dunk in the new ‘LOWER FOR LONGER’ forecast. Income oriented investors will buy these kinds of units with proceeds from interest income units (ETFs or mutuals).
Modern portfolio theory started in the early 1950’s. Before then people looked at stocks individually. The new theories grouped them and as a group they could be analyzed differently. Stocks as a group had much less and better definable risk. In the pre-1950’s stock markets, stocks yielded a lot more than bonds because taken individually a given company’s earnings and dividends would make their stock much riskier than a bonds. But as part of a large portfolio or index the diversification would reduce risk. That set the stock market valuation on a 60 year uptrend where earnings were the key factor for huge institutional investors and dividends were just an afterthought. I believe that dividend ETFs will change the investing landscape for this sector. Taken as a group, the safety of dividends and the predictability of future increases dramatically.
If an experienced investor like us, looks at higher yield individual stocks, we will think they are overpriced. That’s because we are still locked in the old ‘normal interest rate’ thinking. Take the utility and staples sectors. Up above in Cam’s report we see them at much higher PEs than history. That seems way too expensive. But on a long term dividend basis you get 3.2% and 2.3% yield now compared to a 2% long term treasury. The dividend yield will very likely be growing at much better than the inflation rate while the bond yield is locked. When you look around the new digital economy, where is there an industry or company that will surely be robust in 20 years? Banking? Fintech could kill them. Auto Manufacturing? Driverless cars will do away with ownership. Apple? Another Blackberry candidate. Microsoft? Who knows? Nike? New and improved can only go so far. They are a crap shoot but utilities and Colgate Palmolive (staples) will be around for sure and doing well. So I believe in five years people will look back at these two sectors and say they were great investments. For me, I’d rather own them as part of a dividend ETF (Select Dividend ETf has over 9% in utilities). That way I don’t have to cringe at their PEs and think myself stupid for buying them.
This post is long but hopefully it offers a different viewpoint that offers a reasonable bullish outlook.
@Ken Thank you for the comment. If the Lower For Longer thesis is correct it implies slow growth and that can easily be disrupted by increasingly volatile politics (i.e. Brexit, Mr. Trump, China Sea, China Debt, etc.) and a slip up by one of the major economies both can easily create significant uncertainties in the market and real economy. I am not sure how fragile global markets are but I think we should move more cautiously than ever before. But then again if the economy is in trouble maybe these dividend ETFs will also be one of the better performing asset albeit with negative total return.
@Ken
Awesome job explaining another angle. Thanks for your comment.
–Moe
I think the difference this time about the “bearish calls” that Cam is referring to is not coming from the Zero Hedge perpetually bearish crowd. When people who have long track records: Stanley Druckenmiller, George Soros, Paul Singer and Carl Icahn turn bearish it is worth giving their thoughts some consideration.
Momentum indicators like the Coppock Curve are great in smooth trending markets. In 1987 when we had portfolio insurance they would have got you out at the bottom. Trend following, moving averages etc. work well till they don’t.
The Vix jumping substantially in two – three days is showing the frailty of the financial system. The market is reaching the conclusion that zero interest rate policy followed by the various Central Banks is a failure. Look at Japan and its Abenomics. I think Cam has touched upon the Bond market being in a bubble but what most investors are missing are the ramifications of that: The likely implosion of the European Banks. Most of them are “Dead Men Walking”. Take a look at the charts of Deutsche Bank and Credit Swiss. Not to forget the Italian and Spanish Banks. The black swan event can be the derivative positions on their books.
I think the best indicator of a stock market is how it reacts to news. When Janet Yellen’s news conference was over. The market rallied initially and then sold off in the last 15 minutes. This was contrary to what had happened in the past when each statement of ultra loose policy made the market giddy and go higher. Maybe, the market is saying no more or is fearing a recession. Personally, I would now watch June 23. If UK decides to stay in and the market does not rally that would be a very ominous sign.
In any case so far we have a well defined trading range with the boundaries of the previous high and the February lows. Now another line in the sand has been drawn -2040 on the S&P. Here we have a multitude of long term moving averages. If that is broken we can start a sizable downturn.
Ken is absolutely right. Current PE ratio may be high, but in a low interest rate and low inflation environment, such a PE ratio may be justified. I call the current market Teflon market, nothing has phased it so far. Janet Yellen gave a green signal for low rates for a while to come, that should be music to the ears of investors. The goal would be to buy high quality companies with good balance sheets with good dividend on one hand and balance it out with higher growth names, oil majors and minors, precious metals and minors to round off a portfolio. The US economy is not contracting. Americans who foreclosed on houses in 2005, are now back in the market after ten years (it takes ten years to wipe of a foreclosure). The wave of new buyers (ones who foreclosed earlier) has started in the housing market and banks are running tight lending criteria. This indicates housing market will remain stable. If banks were to lower lending criteria, it would electrify the US housing market.
Here is a chart of the Select Dividend ETF which compares it’s performance to the S&P 500. It is a dynamic link that updates every day so just copy and paste this to an email to yourself and keep the email for easy reference. Stock prices of strong dividend paying companies should outperform for several years as investors come to believe rates will be lower for longer.
https://product.datastream.com/dscharting/gateway.aspx?guid=0c2cc561-12b1-49b7-8903-df3bbd45f242&action=REFRESH
Does it make sense to compare current forward estimates to those of a year (1992) when the economy is just beginning to exit a recession? That time period includes the pent up demand for goods and services that built during the recession. A Fed that was just becoming accommodative. Growing sales and profit margins.
One could argue current estimates are overly optimistic. S&P 500 sales and margins have been falling for three quarters. Margins having recently fallen from all time highs. To achieve current 2017 estimates, sales are expected to grow 7.5%, and margins expend to a NEW all time high.
Dear Cam,
I’m afraid I won’t please you with some hate mail. Since I suspect you could be right. But I would like to play the devil’s advocate. This might be the most pessimistic bull market. Perhaps it’s even so pessimistic that this bearish sentiment is here to stay. Who knows? Perhaps this will be the bull market that everyone will remember as: “The bull market they stopped believing in long before it stopped.” How could you know it couldn’t be? I have little doubts in your expertise. If you’re telling me that a bear market is just not here yet, I’m believing you. And with all the data you share, I feel quite at ease to do so. But I am really still doubting whether or not this bearishness isn’t here to stay.
Ken, if you are correct, then the next bear market in stocks would be one of epic proportions. You’d have a vastly and historically overvalued market combined with a rush of folks who want to chase yield somewhere other than in stocks.