Trend Model signal summary
Trend Model signal: Risk-off
Trading model: Bullish
The Trend Model is an asset allocation model which applies trend following principles based on the inputs of global stock and commodity price. In essence, it seeks to answer the question, “Is the trend in the global economy expansion (bullish) or contraction (bearish)?”
My inner trader uses the trading model component of the Trend Model seeks to answer the question, “Is the trend getting better (bullish) or worse (bearish)?” The history of actual out-of-sample (not backtested) signals of the trading model are shown by the arrows in the chart below.

Update schedule: I generally update Trend Model readings on my blog on weekends and tweet any changes during the week at @humblestudent.
Two views of the market
As the market has been experiencing a high degree of volatility, this week’s post will be split into two parts, which reflect the divergent views of my inner trader and inner investor. While my inner trader believes that the markets will be volatile and treacherous for bulls and bears alike, my inner investor thinks that concerns are overblown. Investors shouldn’t feel paralyzed like mid-Atlantic Americans are by the Jonas blizzard this weekend, as those fears will all melt away by spring, if not before.

The first part of this post analyzes the market within the context of a long-term framework. The second outlines my most likely near-term scenario for stock prices. The analytical framework I will use is a modified one based on a post by Jesse Livermore at Philosophical Economics. It is consistent with my belief that extended bear markets are caused by one of the following:
- War and rebellion that causes the permanent loss of capital;
- Recession; or
- An overly aggressive central bank tightening monetary policy, which often pushes the economy into a recession.
Watching for recession risk
Since the immediate threat of war and rebellion are highly unlikely, I will focus mainly on the risk of recessions. I use a modified approach to the one proposed in Jesse Livermore, where he outlined an asset allocation model for timing the stock market. First, he showed a hypothetical perfect foresight strategy of switching to cash one month before the onset of a recession and then buying back into the stock market a month before the end of a recession. This strategy would have beaten a buy-and-hold benchmark by avoiding the bear market losses that coincide with those economic downturns. I would point out, however, that this strategy wasn’t perfect as it did not sidestep the 1987 stock market crash (though calendar year 1987 stock market returns were slightly positive).

He went on to propose a strategy called Growth Trend Timing (GTT), which does not require any foresight, that nearly matches the performance of the perfect strategy.

His post is rather long, but well worth reading in its entirety. For the impatient, I’ll just cut tot the chase. The GTT strategy is based on a conditional assessment of the economic environment. When recession risk is low, buy and stay long the stock market. When recession risk is high, utilize a moving averaged based trend following strategy on the market to avoid losses. His proposed time recession risk indicators consist of the following:
- Real Retail Sales Growth (yoy)
- Industrial Production Growth (yoy)
- Real SP 500 EPS Growth (yoy), modeled on a total return basis.
- Employment Growth (yoy)
- Real Personal Income Growth (yoy)
- Housing Start Growth (yoy)
What is GTT saying now?
Readers probably want to know what GTT is saying about the market right now. The answer is predictably mixed. Real retail sales growth, employment growth, real personal income growth, and housing start growth are all healthily positive, reflecting strength in the domestic U.S. household sector. If you choose to build GTT on those signals, then you will be long right now, even though the market’s current price trend is negative. Of course, weakness in the energy sector, China, and the global economy more generally win out in the current tug of war with domestic U.S. strength, then the strategy, in failing to sell here, or in failing to have sold at higher levels, is going to take deeper losses.
At the same time, real Total Return EPS growth, industrial production growth, and production proxies that might be used in place of industrial production growth (e.g., ISM readings), are flashing warning signals, consistent with known stresses in the energy sector and in the global economy more generally (especially emerging markets), which those signals are more closely tied to. If you choose to build GTT using those signals individually or in combination with others, as I chose to do at the beginning of the piece, then given the market’s current negative trend, you will be in treasury bills right now–especially if you are using the daily version of the strategy, which is advisable, since the daily version shrinks the strategy’s gap losses at essentially no cost. Bear in mind that if strength in the domestic economy wins out in the current tug of war, then the strategy on this construction is likely to get whipsawed.
In effect, most indicators are green, except for real EPS growth and industrial production.
Cam here: I would tend to discount both of those readings because they are distorted by the effects of USD strength, which should abate Q1 or Q2. To put the concerns about EPS growth into context, the latest update from John Butters of Factset shows that forward 12-month EPS is looking a little wobbly. However, recessionistas should note that the decline is nothing like the experience of 2008, when expectations of EPS growth cratered (annotations in red are mine).

How worried should we be about the decline in forward EPS? Analysis from Goldman Sachs Investment Management put a different spin on the situation. The decline in EPS growth and margins is entirely attributable to weakness in the energy sector. As energy prices stabilize and perhaps turn upwards, the earnings outlook should improve (also see my last post A possible generational low in oil and energy stocks).

Another way of thinking about the decline in forward EPS is that it is related to the weakness in industrial production (blue line below), which has gone negative and has raised cautionary flags. On the other hand, the softness in industrial production seems to be highly correlated to the direction of the USD (note inverted scale for the trade-weighted dollar indices).

Upward momentum in the trade weighted dollar is petering out. Barring another significant USD rally, we should start seeing much better YoY comparisons in Q1 and Q2 – and that should be helpful for the earnings outlook going forward.

Last week’s release of Markit PMI, which is a timely proxy for industrial production, beat expectations and turned up. That`s another constructive sign for a growth revival.

Same philosophy, different implementation
The approach advocated by Jesse Livermore of staying long stocks based on macro-economic indicators of recession risk and then switching to a more risk-controlled investment process using trend following models is a highly useful technique for investors.
I like his investment philosophy, but prefer to implement it differently using a different set of recession indicators. As regular readers know, I maintain my own set of Recession Watch indicators, which are primarily based on the work by New Deal democrat and his interpretation of insights of Geoffrey Moore. These indicators are designed to spot an economic slowdown a year in advance. By and large, most of them are not showing any signs of recession risk. Here are ones flashing green, signaling continued economic expansion (links are to FRED charts):
- Housing starts (Housing starts peaked at least one year before the next recession)
- Real money supply growth (In addition to the 1981 “double dip,” on only 2 other occasions have these failed to turn negative at least 1 year before a recession)
- Yield curve (The yield curve inverted more than one year before the next recession about half the time)
- Residential real private investment (Aside from the 1981 “double-dip,” and 1948, it has always peaked at least one year before the next recession)
- Real retail sales (It has peaked 1 year or more before the next recession about half of the time)
- Corporate profits and Proprietors` income, which can be a more timely proxy for corporate profits (Corporate profits have peaked at least one year before the next recession 8 of the last 11 times, one of the misses being the 1981 “double-dip.”)
- Corporate bond yields (Corporate bond yields have always made their most recent low over 1 year before the onset of the next recession).
Based on these metrics, recession risk remains low. New Deal democrat summarized current conditions this way in his weekly monitor of high frequency economic releases:
The economy is experiencing a very severe downturn in energy production and export-related goods production and transport. On the other hand, the manufacturing portion of industrial production is only flat, not down, and the 70% of the economy reflective of domestic consumption remains positive.
There has been a bounce to “less bad” readings in a number of commodity related indicators in the last few weeks, but due to seasonality, let’s give it another couple of weeks before arriving at any conclusions.
In addition, Georg Vrba’s work is also showing low recession risk:

To summarize, my version of GTT concludes it would be premature for investors to even think about a bear market. Downside risk is limited, with the caveat that the next few months will likely be choppy for stock prices until uncertainties over earnings growth and the trajectory of the USD resolve themselves.
Investors should stay long the market and not panic. This is just a correction.
Trading the correction


I could go on, but you get the idea.
V or W shaped bounce?
In light of these stretched sentiment readings, an oversold relief rally is pretty much a foregone conclusion. The bigger question is the shape of the bounce. Will it be a V or W?
Given the ups and downs of earnings season and the fact that most of the anxiety over fundamentals have not been fully resolved, a W-shaped period of sideways consolidation makes sense. My trading plan calls for fading the bounce and waiting for a re-test of the lows. Further, I would not necessarily discount further market weakness that undercuts the most recent lows.
Ultimately, we just have to see how the reflex rally evolves and here is what I am watching. One key indicator to watch is how overbought market breadth gets on a short-term basis, as measured by this chart from IndexIndicators. If the markets of 2011 and September 2015 are my most likely templates for the current retracement, then I would look for readings to get overbought and reverse at the rally target zones.

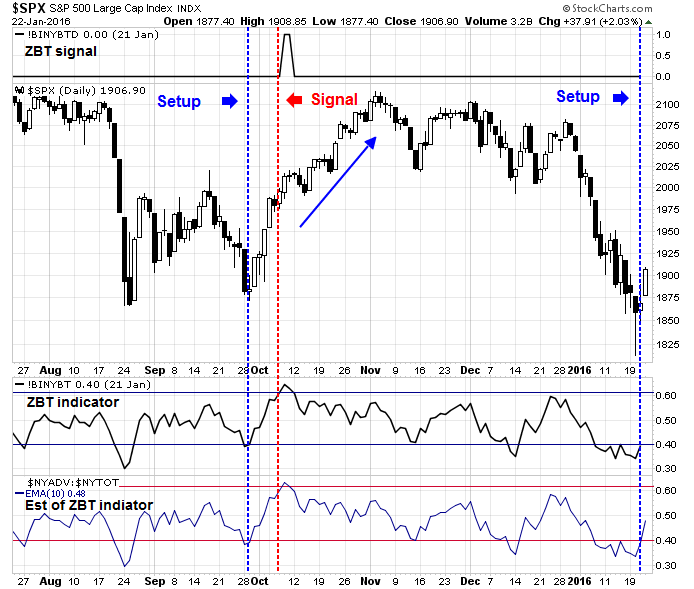
If, on the other hand, I am wrong and the market does experience a V-shaped recovery, then that scenario would imply a powerful reversal in psychology and market breadth. In that case, a rare Zweig Breadth Thrust (ZBT) buy signal would likely get triggered (for a full explanation of the ZBT see Bingo! We have a buy signal). The most likely trigger for such a move would be an unexpected dovish message from the Fed next week.
The chart below shows the SPX, the ZBT signal (top panel), the ZBT indicator (3rd panel) and ZBT indicator estimate (4th panel, because stockcharts tends to be slightly late in updating their ZBT indicators). As the chart shows, a ZBT was triggered last September, which led to a month of market strength. We saw a ZBT setup last week, with Thursday as day 0. The market now has 10 days to get the ZBT indicator up from 0.4 (setup level) to 0.615 (buy signal level).
My inner investor is accumulating positions at these levels, with an overweight position in the resource sectors, much in the way that insiders have been doing for the last few weeks (via Barron’s).
My inner trader has been long the market, but he is carefully watching the daily OBOS readings. He will likely start to scaling out of his long positions should the market get short-term overbought.
Disclosure: Long SPXL, TNA
DO YOU NEED A RECESSION TO HAVE A BAD BEAR MARKET ??????????
another opinion:
http://seekingalpha.com/article/3508206-you-dont-need-a-recession-to-fall-into-a-bear-market
Sitting through severe downturns can be very painful. A 30% drop in price takes 42.85% to break even. Sometimes the stock you own go out of favor. People who bought CISCO, Intel at the height of the boom are yet waiting to break even. At some point one has to cut their losses.
As I’ve been saying, to have a really bad bear market, you need either:
1) A recession
2) A very aggressive Fed
We have neither of those.
Cam, I think you need to define a bear market in context of the index you are using and the % decline. Also, what is a “severe bear market”. In 1987 the market dropped more then 20% in one day. Later, “they” said that the economy did not suffer a recession !.
Recall that in 1987 the Fed had 2 back to back rate rises in September, right into the Crash.
Cam- I was wondering if you could outline the setup to get stockcharts to print the ZBT indicator. I don’t see it on the free list of indicators. If it is unavailable for free, is there something a stockcharts non-member could call up which might approximate it?
Thanks,
RAS
Try this link for a ZBT monitor: http://stockcharts.com/h-sc/ui?s=%24SPX&p=D&yr=1&mn=0&dy=0&id=p26850025728
Pater Tenebarum illustrates a number of indicators that seem to be in recession territory (http://seekingalpha.com/article/3815296-u-s-economy-slip-sliding-away?isDirectRoadblock=false&uprof=46). One of them is the level of commercial and industrial loan charge-offs and delinquencies which are an indicator of financial stress. The energy industry may be only one sector but when they stop paying their suppliers and stop repaying loans there is likely to be spreading contagion and tightening credit. The ongoing depression in land and sea transports is also a source of consternation. On the other paw, I note a lot of residential and commercial construction here on the Florida gulf coast where I avoid Canadian winters.
I like to be optimistic but I fear I am living on borrowed time!
Let me try to answer those questions one by one:
1) Commercial & industrial loan charge offs and delinquencies are rising, but you have to think about the magnitude of the effect on the financial system, which doesn’t seem to be significant: https://research.stlouisfed.org/fred2/graph/?g=2ZFa
2) The slide in transportation is related to the mild industrial recession, which I explained before as related to USD strength
Construction is a big part of the cyclical economy. As you pointed out, housing is still doing ok and as long as housing holds up, it’s hard to see a recession on the horizon.
BTW, if you’re from Canada, you will also know about silliness like this: https://www.youtube.com/watch?v=QKqw-Mbx2Q0&feature=youtu.be
It will not end well, the question is timing – which is…not yet.
Cam-
The Canadian banks pretend that they were smarter than the US banks but I remember Countrywide was getting established in Canada back in 2005 and the Banks were itching to get into the game – they started buying US regionals in frustration. They were also selling ‘AAA’ grade CDO’s to Canadian businesses hand over fist as ‘guaranteed’ short-term parking.
My son lives in Vancouver and he is sitting on cash and patiently waiting!
Roy
For those of us in Vancouver, please remember to post when you think “not going to end well” is coming up fast!
We are getting pretty close to the upper end of this signal are we not (.57 vs. .615), and it is day 6?
Use this as a real-time monitor. The 2nd bottom panel is the “official” signal, but it’s slow updating. The bottom panel is the estimate: http://stockcharts.com/h-sc/ui?s=%24SPX&p=D&yr=1&mn=0&dy=0&id=p09286954915