Preface: Explaining our market timing models
We maintain several market timing models, each with differing time horizons. The “Ultimate Market Timing Model” is a long-term market timing model based on the research outlined in our post, Building the ultimate market timing model. This model tends to generate only a handful of signals each decade.
The Trend Model is an asset allocation model which applies trend following principles based on the inputs of global stock and commodity price. This model has a shorter time horizon and tends to turn over about 4-6 times a year. In essence, it seeks to answer the question, “Is the trend in the global economy expansion (bullish) or contraction (bearish)?”
My inner trader uses a trading model, which is a blend of price momentum (is the Trend Model becoming more bullish, or bearish?) and overbought/oversold extremes (don’t buy if the trend is overbought, and vice versa). Subscribers receive real-time alerts of model changes, and a hypothetical trading record of the those email alerts are updated weekly here. The hypothetical trading record of the trading model of the real-time alerts that began in March 2016 is shown below.

The latest signals of each model are as follows:
- Ultimate market timing model: Buy equities
- Trend Model signal: Bearish
- Trading model: Bearish
Update schedule: I generally update model readings on my site on weekends and tweet mid-week observations at @humblestudent. Subscribers receive real-time alerts of trading model changes, and a hypothetical trading record of the those email alerts is shown here.
Recession fears are rising
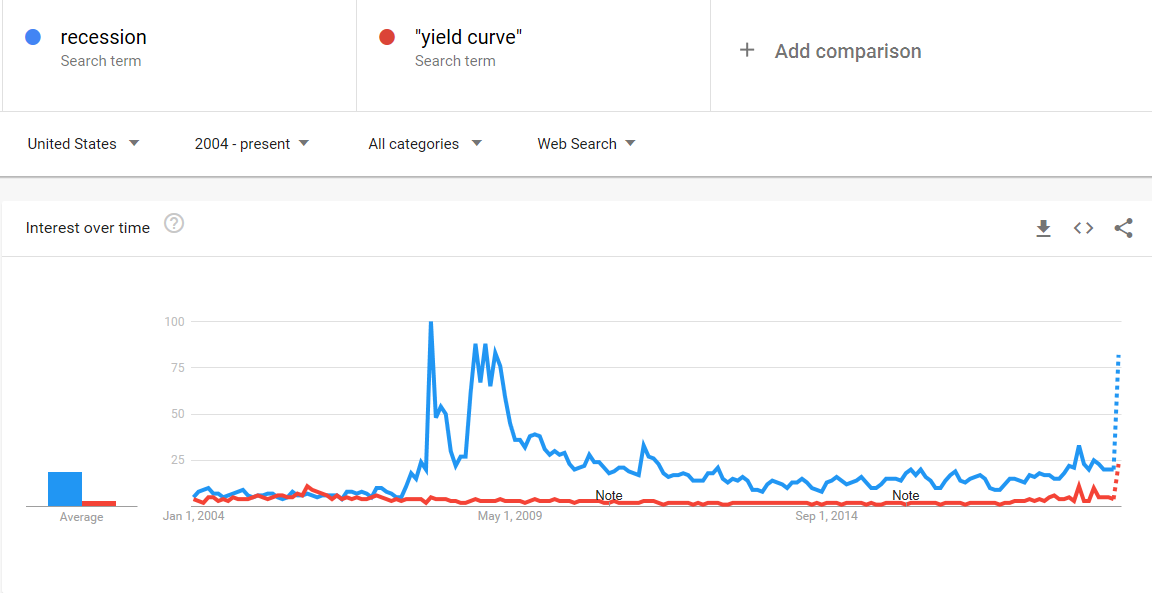
The whiff of recession is in the air, and anxiety levels are rising. Analysis from Google Trends reveals that searches for the terms “recession” and “yield curve” have spiked.
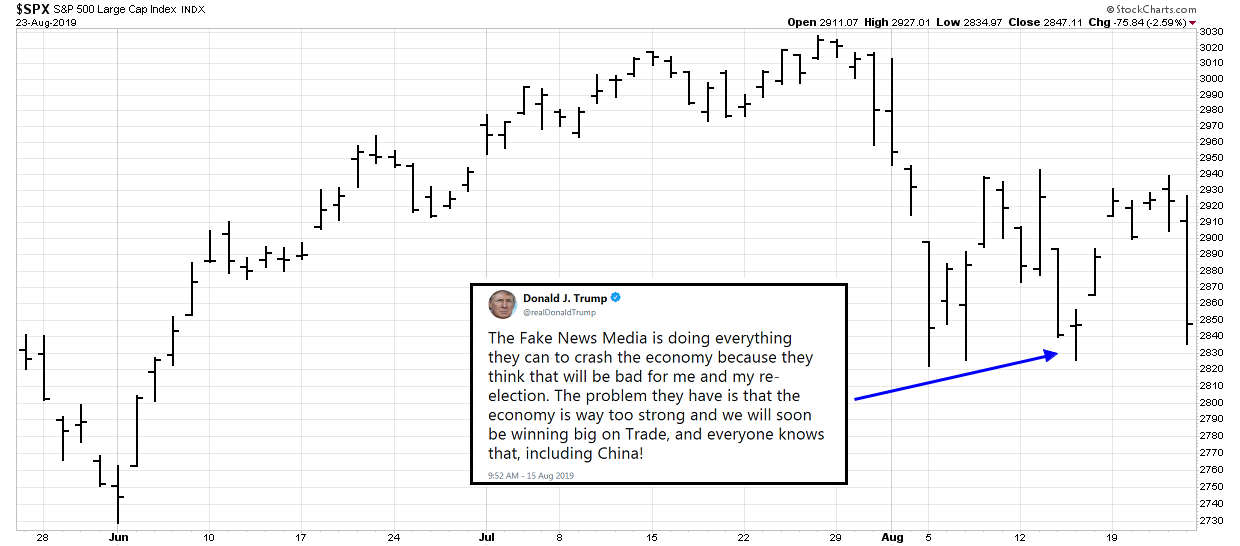
Tariff Man is getting worried. At the nadir of last week’s stock market decline, Trump tweeted, “The Fake News Media is doing everything they can to crash the economy because they think that will be bad for me and my re-election”.
The New York Times reported Trump is convinced that there is a conspiracy to distort economic data and exaggerate the prospect of a recession,
President Trump, confronting perhaps the most ominous economic signs of his time in office, has unleashed what is by now a familiar response: lashing out at what he believes is a conspiracy of forces arrayed against him.
He has insisted that his own handpicked Federal Reserve chair, Jerome H. Powell, is intentionally acting against him. He has said other countries, including allies, are working to hurt American economic interests. And he has accused the news media of trying to create a recession…
Mr. Trump has repeated the claims in private discussions with aides and allies, insisting that his critics are trying to take away what he sees as his calling card for re-election. Mr. Trump has been agitated in discussions of the economy, and by the news media’s reporting of warnings of a possible recession. He has said forces that do not want him to win have been overstating the damage his trade war has caused, according to people who have spoken with him. And several aides agree with him that the news media is overplaying the economic fears, adding to his feeling of being justified, people close to the president said.
How serious are the recession risks? What should and shouldn’t equity investors be worried about? We examine some details.
I find that investors should distinguish between real risks and red herrings for stocks. Downside equity risk from a recession is relatively low, and we are less concerned about the signal from the yield curve. If a recession is in the cards, it has to be one of the best anticipated and telegraphed slowdowns in the post-War era.
On the other hand, investors should be wary of a rising USD, and how the market may discount the outcome of the U.S. presidential election in 2020.
The yield curve signal
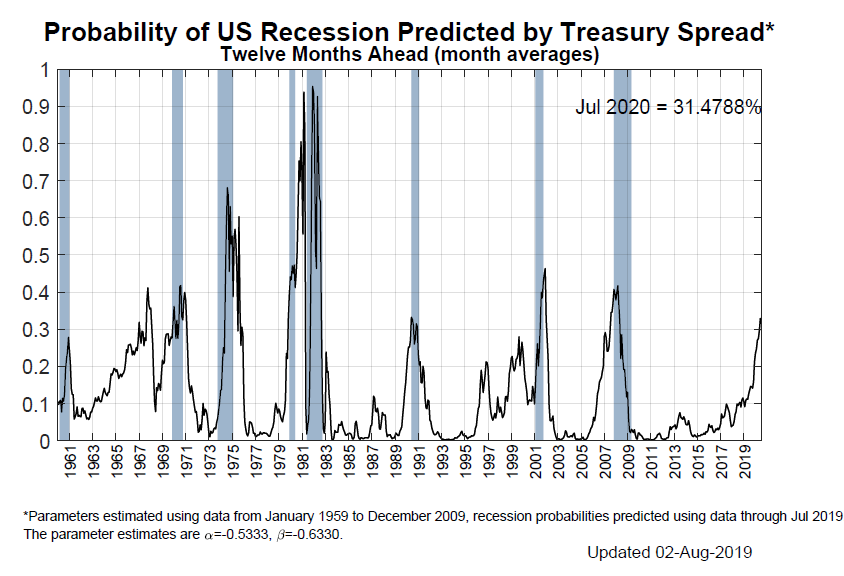
Numerous recession alarms have been raised based on the shaped of the yield curve. The New York Fed’s recession model, which is based on the yield spread between the 10-year note and the 3-month bill, has spiked to levels consistent with past recessions.
As an equity investor, I am inclined to discount the message from the yield curve for several reasons. For an even-handed perspective, here is what Fed watcher Tim Duy had to say about the yield curve:
I have long been a fan of the yield curve as one tool to track the economy, and it is sending unwelcome signals this year. Yields on 10-year notes fell below those on two-year notes on Wednesday for the first time since 2007. Another portion of the yield curve, the spread between three-month bill rates and 10-year yields, which is the favored recession signal for the economists at the Federal Reserve Bank of San Francisco, has been inverted since May. It’s no wonder that market participants are increasingly concerned with the economic outlook.
Historically, whenever the spread between two- and 10-year yields inverts, a recession follows six to 24 months later. The Fed, though, typically ignores this signal because inversions happen well ahead of a downturn and when the Fed is more worried about inflation than recession. Also, an inversion was often the only sign of recession. In fact, the Fed has often continued to raise policy rates after an inversion. That sequence of events – the Fed tightening after the yield curve inverts – tends to precede a recession.
Duy then raises the question of what happens if everyone is watching a single metric. Will its forecasts work as well? The Fed is watching the yield curve flatten and it has responded with an easier monetary policy.
The upshot is that the yield curve has been a good predictor of a recession in part because the Fed did not believe it had any special significance. Once the Fed finds significance in the yield curve, then its usefulness as a recession predictor likely drops sharply. In addition, downside risks to the economy have already forced the Fed to loosen policy, and more rate cuts are coming. The Fed will lower its target for the federal funds rate again in September, and a 50-basis-point cut can’t be ruled out.
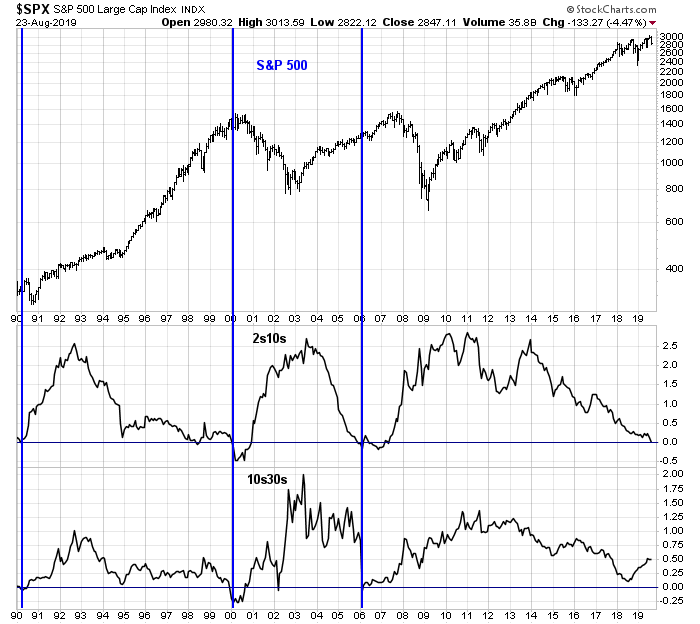
Another reason I am inclined to doubt the message of the yield curve is its odd behavior during the latest inversion episode. The chart below shows the 10-year and three month spread (top panel), 10-year and 2-year spread (middle panel), and 30-year and 10-year spread (bottom panel). The unusual nature of the latest episode is how the curve has inverted. While the short end (3m10y) has inverted, and the belly of the curve (2s10s) is flattening, the long end (10s30s) has been very steep and it has only just started to flatten.
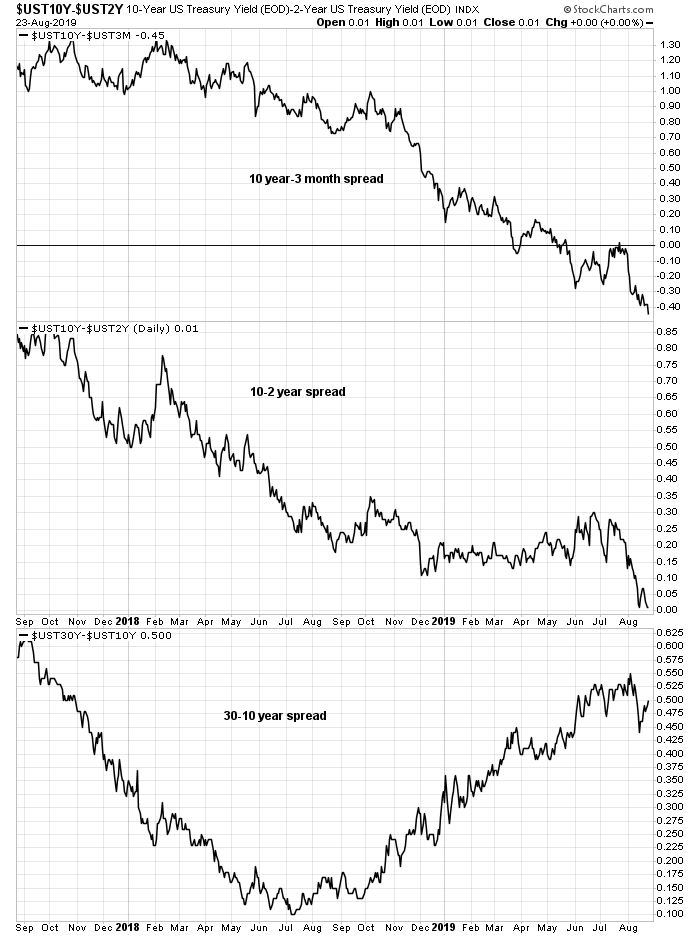
Past episodes of yield curve inversions that have preceded recessions and equity bear markets has seen the 10s30s invert as well, which has not happened this time.
Finally, the mechanism of how an inverted yield curve signals recession may not be in place this time. Sri Thiruvadanthai, who is Director of Research at the Jerome Levy Forecasting Center, pointed out that a flattening yield curve has presaged a slowdown in household leveraging.
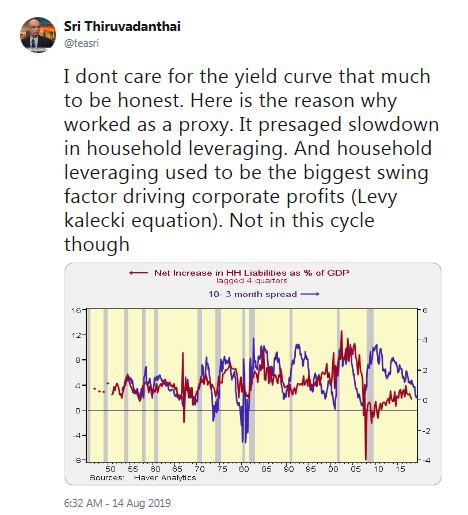
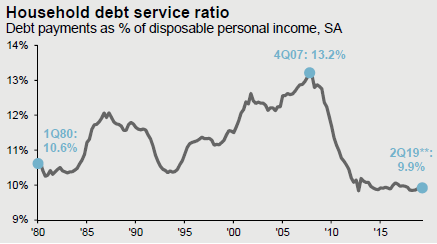
The household sector deleveraged after the last crisis, and its balance sheet is not under stress. A flattening yield curve is unlikely to have much of an effect.
New Deal democrat’s “recession watch”
The blogger New Deal democrat has a highly disciplined recession model, and these days he sounds worried. He categorizes economic indicators into coincident, short leading, and long leading indicators. His latest concern is based on the BLS revisions in unit labor costs, which is an input into a group of corporate profit metrics as part of his long leading indicators:
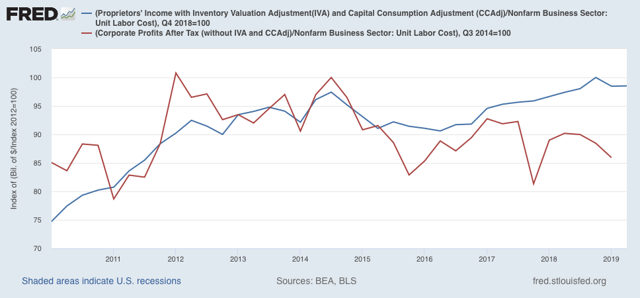
One of the four long leading indicators Prof. Geoffrey Moore studied for decades, and published in 1993 is corporate profits deflated by unit labor costs. While the corporate profits data remains the same, yesterday the BLS updated unit labor costs through Q2 of this year, and made some major backward revisions going all the way to 2014.
The chief result is that, especially in the past two years, until labor costs have increased at a significantly greater rate than had been published previously – and Q2 unit labor costs rose 0.6%.
This has two effects. The first is that adjusted proprietors’ income, which is my placeholder until corporate profits is reported in two weeks, actually declined in Q2 – the second straight quarter of slight decline. But more importantly, instead of going basically sideways, NIPA corporate profits have declined sharply since their peak in 2014 – by a total of about -16%:
The recent history of his real-time outlook has been no recession, but this BLS revision makes the forecast a little wobbly.
I went back and checked my long range forecast 12 months and 6 months ago. In both cases, corporate profits were listed as a positive. These revisions mean that corporate profits would have been a negative in both periods.
Twelve months ago, I wrote that there were 4 positives and 2 negatives. Six months ago, I wrote that there were 2 positives and 3 negatives. With these revisions, the results would have been 3+, 3- and 1+, 4- respectively.
As a result, I probably would have gone on recession watch last September when it became clear that housing had peaked, and the recession watch probably would have started in Q2 of this year rather than Q4 (Remember that for me a “recession watch” is like a “hurricane or tornado watch” from the NWS – conditions are favorable, but by no means a certainty).
In other words, he would have downgraded his long-term outlook last September. As his long leading indicators look out about 12-18 months, it puts the economy in a very fragile position today. Indeed, his short leading indicator readings have been weak but volatile. In addition, the trade war has weakened business confidence, which is another negative. A recent New York Fed survey concluded that tariffs and trade policy is pushing up prices and reducing profits.
NDD concluded that the economy is undergoing a high risk period in late 2019:
As a result of the big negative revisions to adjusted corporate profits, Q2 corporate profits becomes perhaps the most important report of the last 10 years. A producer-led recession similar to that of 2001 becomes a more significant possibility. This winter remains in the bull’s eye of my recession watch.
He followed up in a separate post that he is emphatically not calling for a recession, and we are “not doomed”. To be sure, the economy is undergoing a soft patch, and it is vulnerable to shocks.
Even if the economy were to enter a downturn in Q4 2019, this does not matter as much for equity investors, because markets are inherently forward looking, and stock prices tend to look ahead 6-12 months. If there is a slowdown or mild recession in late 2019 or early 2020, arguably the market anticipated the weakness when it fell in Q4 2018.
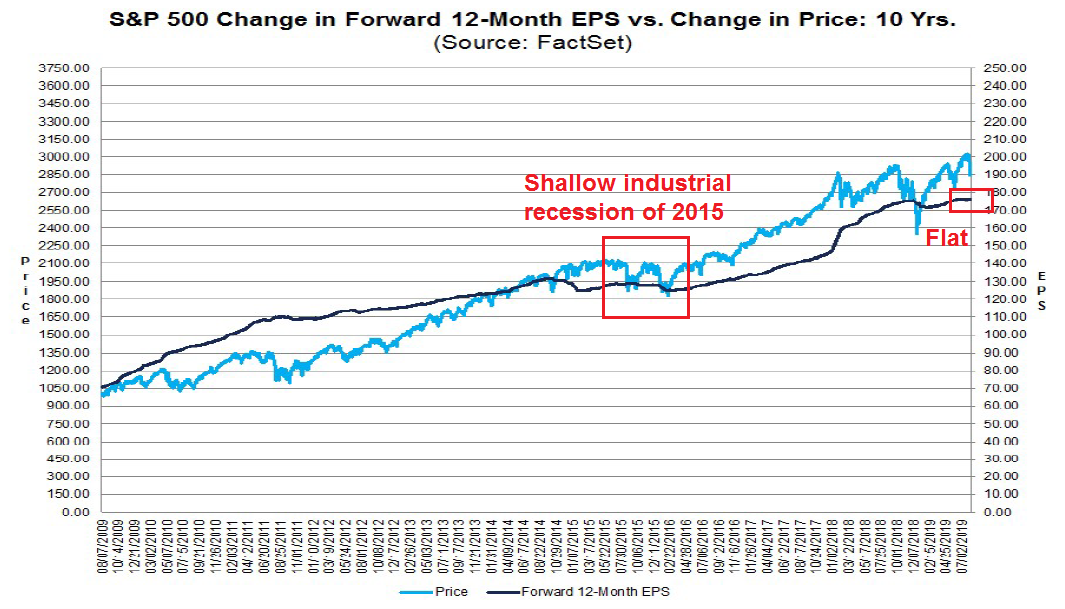
And if you believe the stock market downdraft in late 2018 did not discount the economic weakness late this year, the slowdown will likely be similar to the mild industrial recession of 2015, when oil prices fell but the rest of the economy continued to grow. During that period, forward EPS estimates flattened, and stock prices hiccupped, but the declines in 2015 were milder than the drawdown in late 2018.
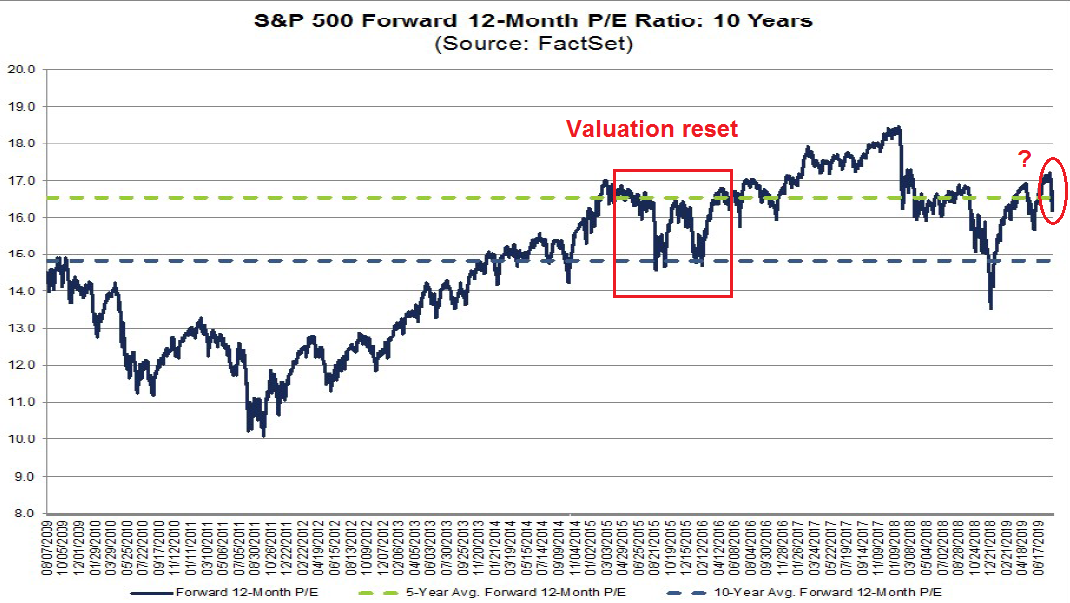
In fact, the 2015 episode provided a valuable buying opportunity, based on a valuation reset. If an equity investor cannot stomach mild setbacks like what we saw in 2015, they should not be taking equity risk.
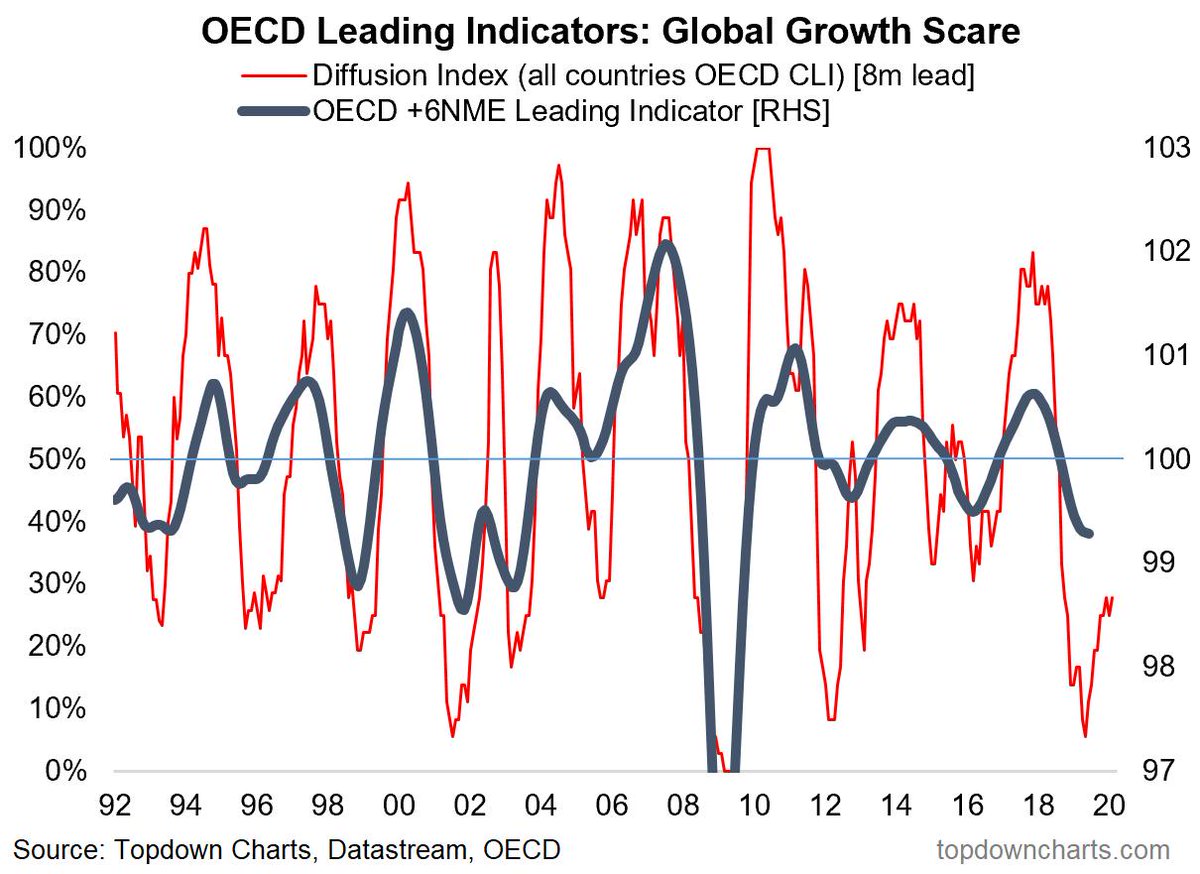
Analysis from Callum Thomas of Topdown Charts shows that the latest soft patch is likely to be temporary in nature, and global growth is set to resume in 2020.
What are you so worried about?
Beware of USD strength
While I am not concerned about the yield curve signal and a possible late 2019 slowdown, here is what equity investors should be worried about.
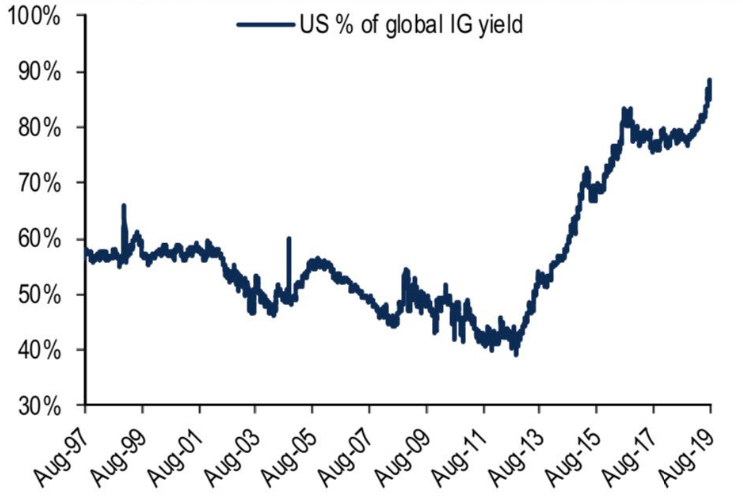
The greatest risk is USD strength, as a confluence of factors are serving to put a bid on the greenback. BAML found that the US share of investment grade bonds is skyrocketing. As sovereign debt yields are pushed more and more into negative territory, this forces bond managers into USD denominated debt, and creates a demand for dollar assets.
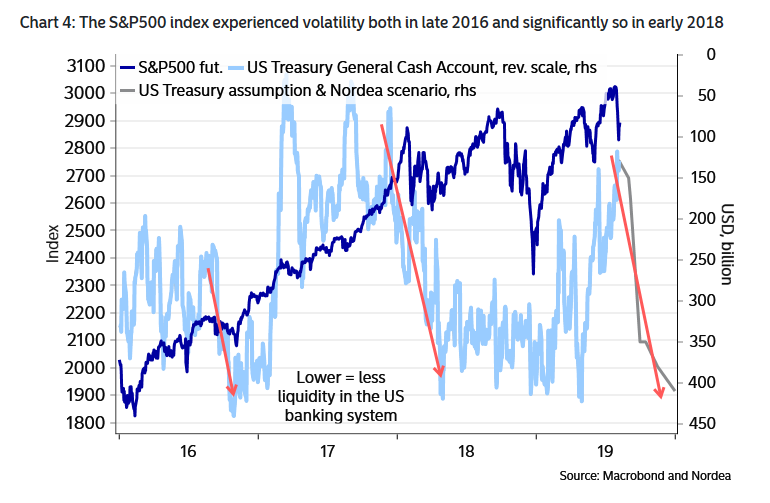
In addition, I had highlighted in the past research from Nordea Markets indicating the debt ceiling deal is likely to drain USD liquidity from the banking system. In the past, falling USD liquidity has historically been negative for risk appetite.
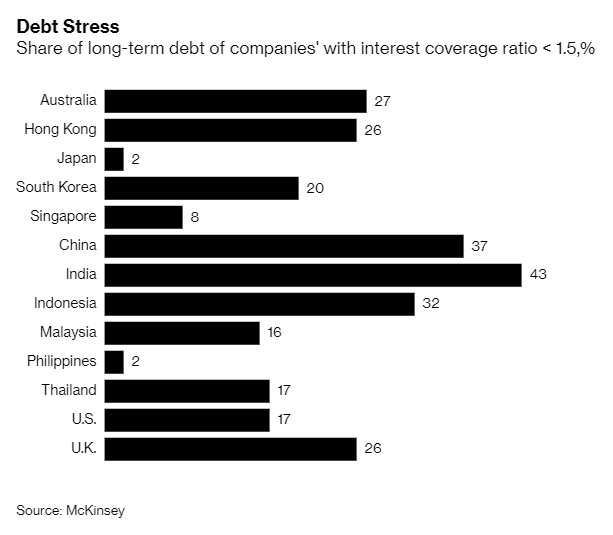
A rising USD is negative for risk assets in several ways. First, it creates a headwind for the earnings of US large cap multi-nationals operating in foreign markets. As well, a rising greenback raises the risk of an adverse response from the Trump administration in the form of currency war. Lastly, it exposes the vulnerability of fragile EM economies with current account deficits. A recent McKinsey study found that a growing proportion of companies in EM economies such as China, India, and Indonesia have highly levered balance sheets.
In particular, China’s growing external debt position, which is about USD 1 trillion, is becoming a concern. Bloomberg recently report that HNA Group was forced to miss a yuan note payment in order to repay a USD bond. In addition, the shares of the highly levered property developer China Evergrande continues to test a key long-term technical support level.

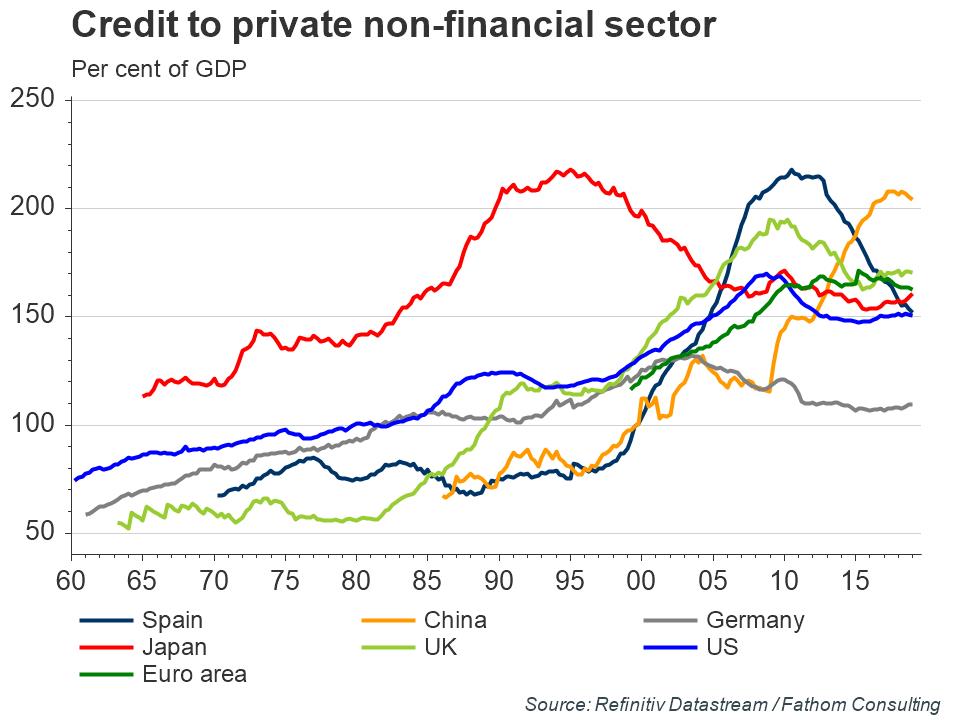
The Chinese corporate sector is showing signs of stress. As a reminder, the China bears’ favorite chart shows debt at dangerous levels. Will USD strength push China over the edge?
Risk levels are rising. Stay tuned.
2020 Election risks
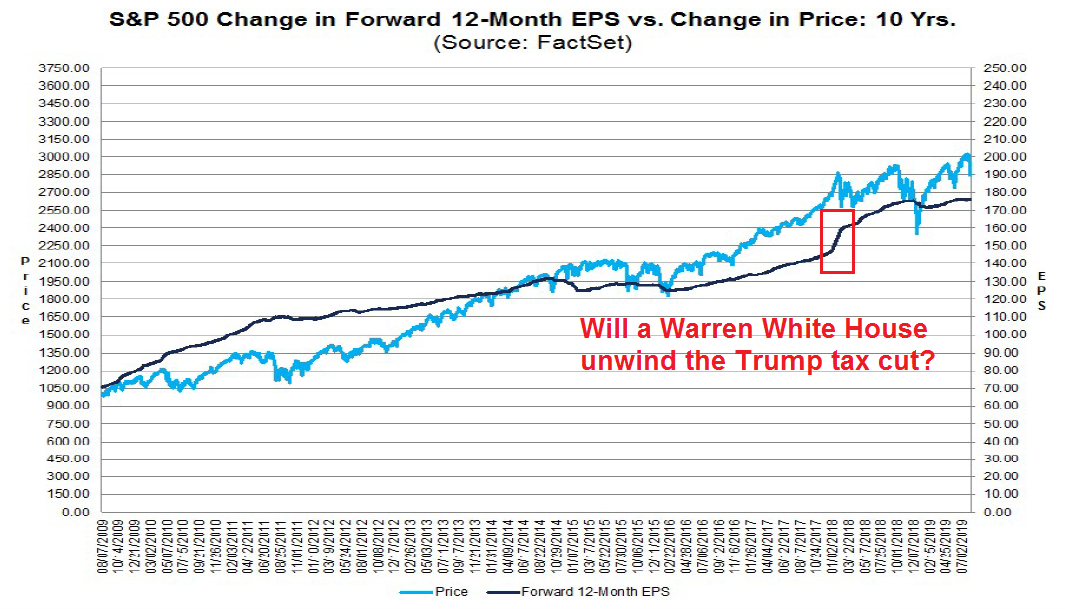
Another risk the market is ignoring is the 2020 election. While the election is a long way off, the latest PredictIt odds shows Elizabeth Warren ahead of front runner Joe Biden for the Democrat’s nomination.
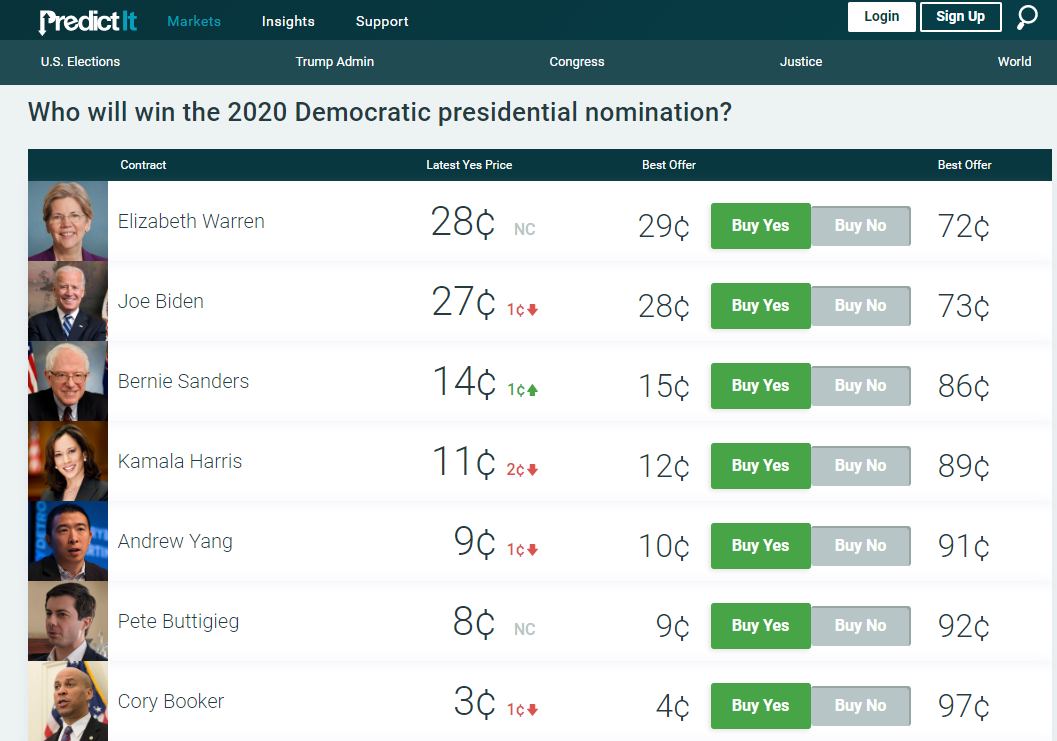
The markets have not even begun to contemplate the possibility of a Warren presidency. Policy is likely to lurch leftward, and, at a minimum, Warren will undo the Trump tax cuts. After-tax earnings received about a 7-9% boost as a consequence of the 2017 Tax Cuts and Jobs Act. Expect the earnings boost to be unwound. To be sure, Warren`s economic policies are likely to be expansionary and re-distributive, but they will be a net negative to the suppliers of capital while a net positive to the suppliers of labor.
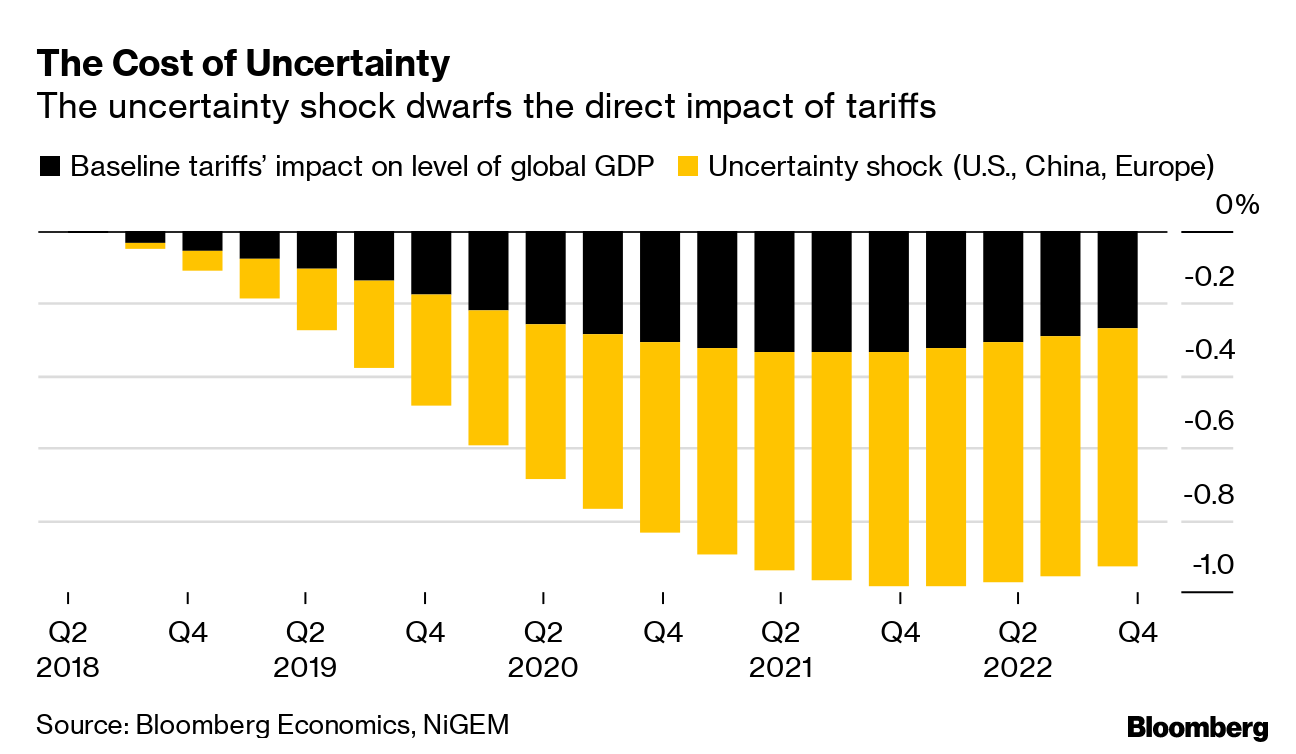
A Trump-Warren contest will put the markets in the unenviable position of navigating between a financial Scylla and Charybdis of Warren`s re-redistribution policies against Trump`s protectionism and tariff wars. For some perspective, Bloomberg Economics recently estimated that the trade war effects on business confidence are roughly equal or higher than the direct impact of the increased tariffs.
Readers can make their decisions based on their own political preferences, but neither outcome can be interpreted as equity bullish.
Risks and red herrings
In conclusion, investors should distinguish between real risks and red herrings for stocks. Downside equity risk from a recession is relatively low, and I am less concerned about the signal from the yield curve. If a recession is in the cards, then it has to be one of the best anticipated and telegraphed slowdowns in the post-War era. Even the New Yorker cartoonist has gotten into the act.

On the other hand, investors should be wary of a rising USD, and how the market may discount the outcome of the US presidential election in 2020.
The week ahead
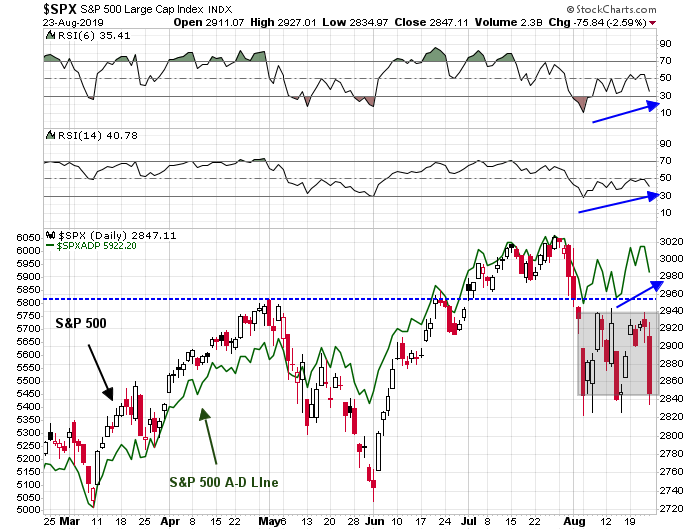
Sometimes life comes at us fast. I had been suggesting in these pages that the market is in a trading range. Subscribers received an email alert on Thursday morning before the market open that the trading model had flipped from bullish to bearish. I did not expect the market to drop from the top of the trading range to the bottom. The SPX is now nearing support while exhibiting positive RSI divergences, and a positive Advance-Decline Line divergence, which is tactically bullish.
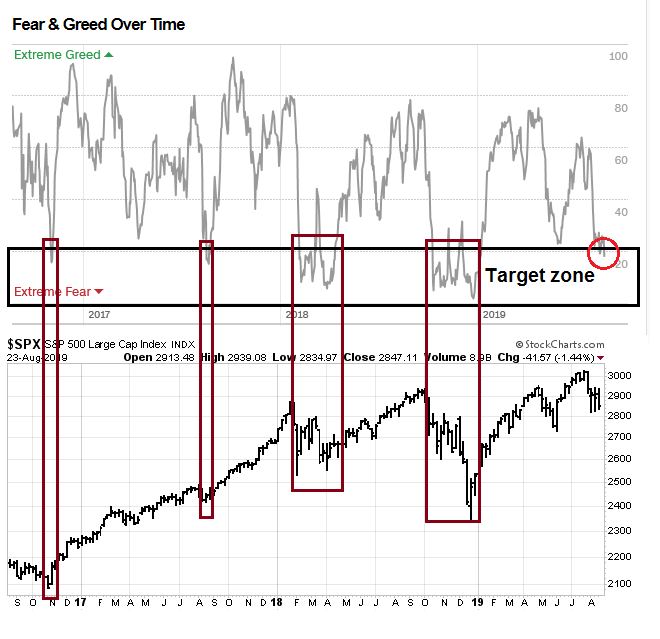
The Fear and Greed Index closed Friday at 18, which is within the sub-20 target zone that has marked market bottoms in the past. While the readings of the index is not a precise timing indicator, it does indicate the market is undergoing a bottoming process.
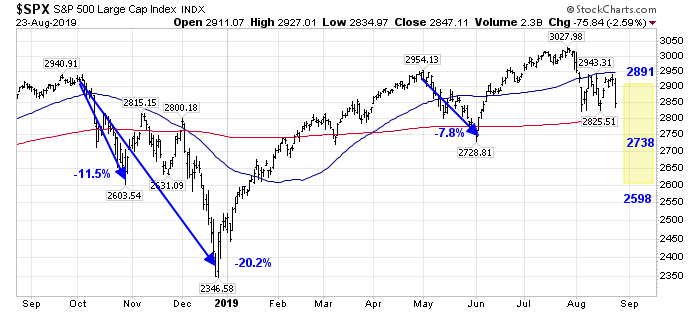
I had also suggested that this is not the beginning of a bear market, but a corrective episode and a welcome valuation reset (see Powell`s dilemma, and why it matters). I had projected a downside range of 2598 to 2891, and the index is in the top half of that range. The market’s current forward P/E ratio is 16.2, which is between its 5-year average of 16.5 and 10-year average of 14.8. While the decline could stop here, there may be more downside risk, along with more choppiness ahead.
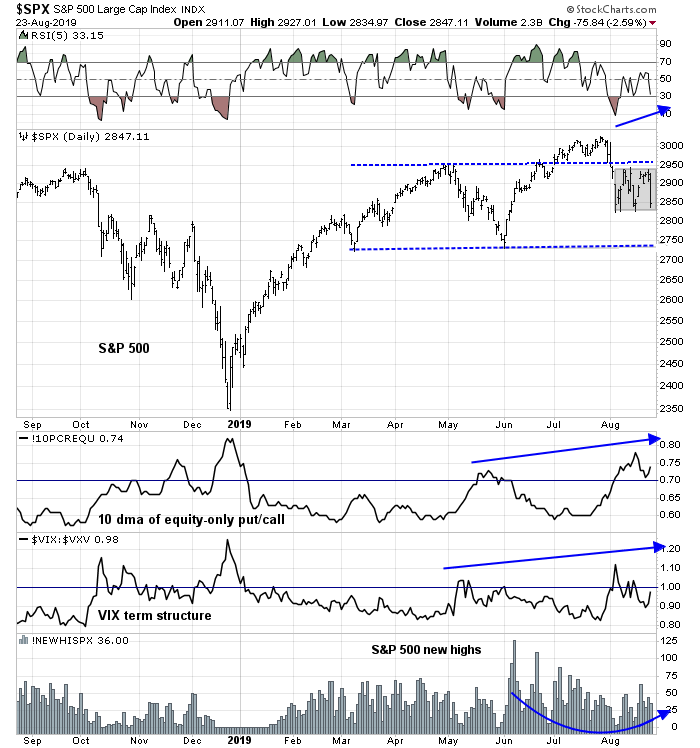
One template for today’s market may be the trading range of 2011, when the market was gripped by the combination of a budget impasse in Washington and the Greek Crisis in Europe. From a technical perspective, the bottom process was marked by positive divergences in the form of improving risk appetite, as measured by the 10-day moving average (dma) of the equity-only put/call ratio, and the VIX term structure. In addition, new highs were improving as the market tested the bottom of the range.

Fast forward to 2019. The market is testing the bottom of its range, and it is flashing a positive RSI divergence, and new high breadth is improving. However, fear indicators are exhibiting higher highs, which may indicate that further consolidation or downside may be ahead. It is possible that the true trading range is not the zone marked in grey, but a wider zone defined by the 2950 breakout level at the top end, and support at about 2740 below.
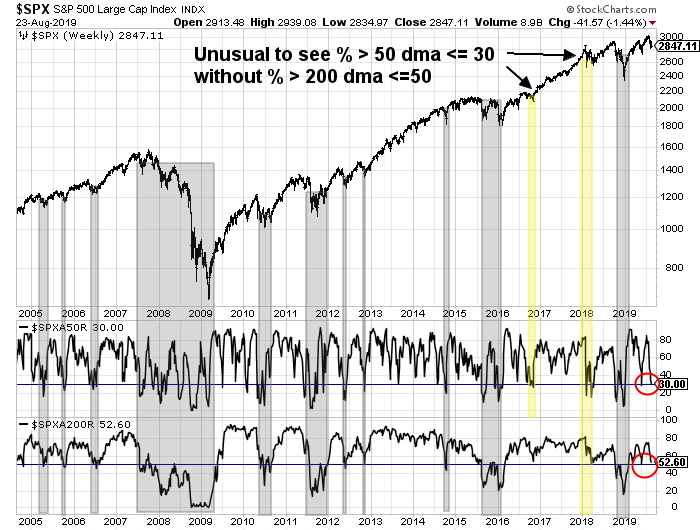
Market breadth indicators suggest further consolidation or more downside from current levels. If history is any guide, it is highly unusual to see the market bottom with % above the 50 dma at the current 30 level without % above 200 dma falling below 50.
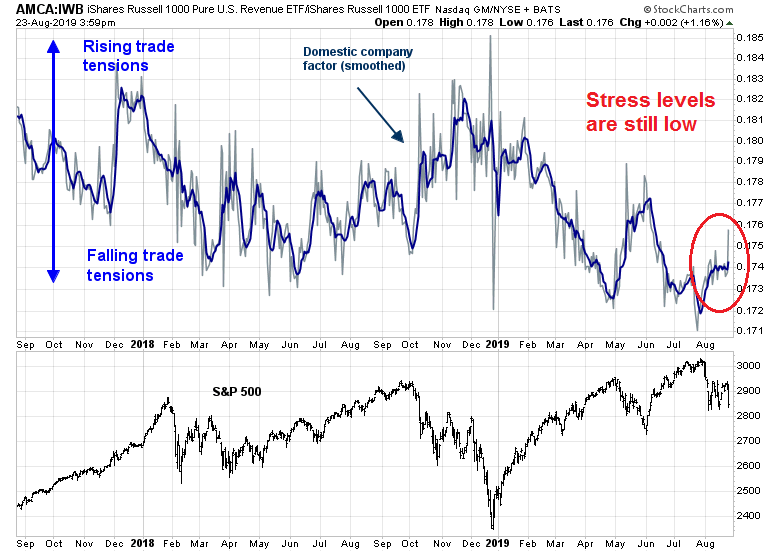
Friday’s market action demonstrated that sentiment is far more concerned about the trade war than Fed interest rate policy. If trade war anxiety is the issue, then the performance of my trade war factor indicates that there could be much more downside risk from current levels.
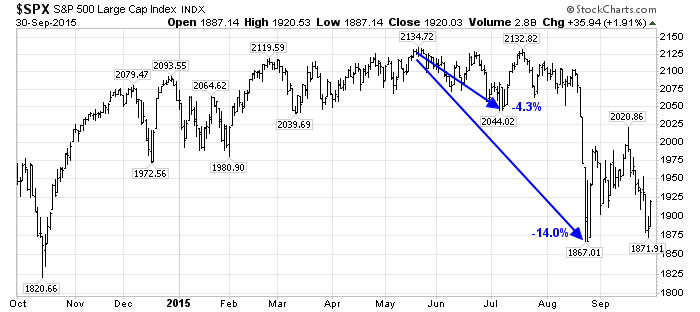
History doesn’t repeat, but rhymes. Instead of a range bound bottom of 2011, another alternative template for today’s market might be 2015. The market chopped around in a narrow range for most of the year, until the consolidation was resolved with a -14,0% peak-to-trough drawndown. This scenario is consistent with today’s macro backdrop of global growth and trade tension uncertainty for the next few months.
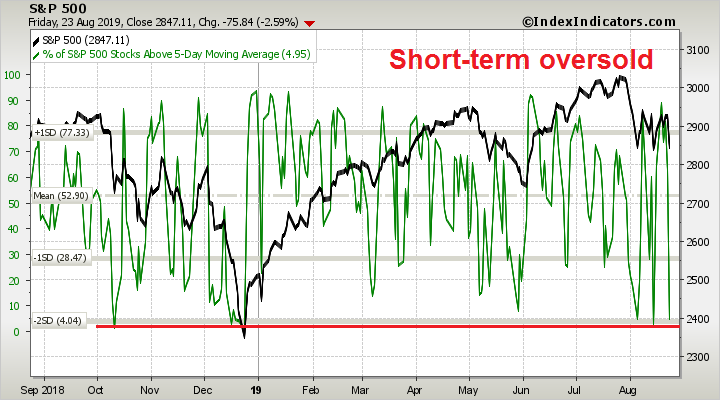
In the short run, the market is due for a bounce. Short-term (1-2 day time horizon) breadth is oversold, and at levels consistent with the start of relief rallies.
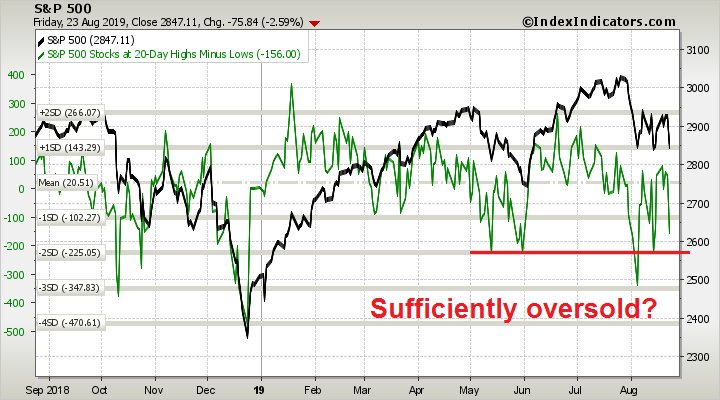
Longer term (1-2 week time horizon) breadth, however, may need further downside in the days and weeks ahead for the market to form a durable bottom.
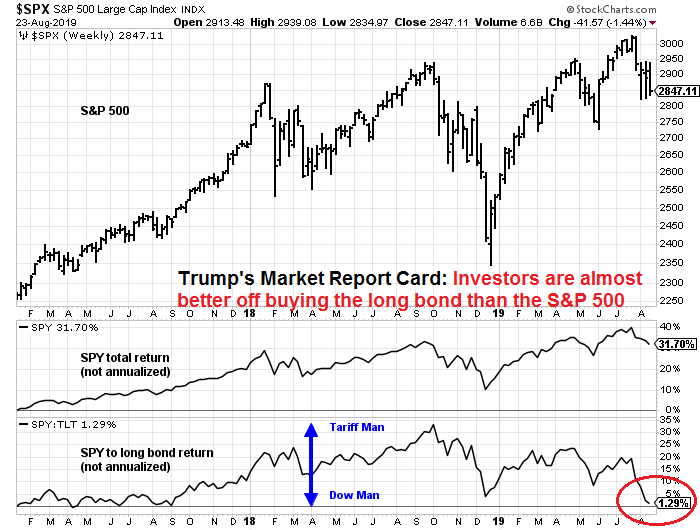
Watch for a market friendly response from Trump soon. Even though Tariff Man was on full display last Friday, don’t be surprised to see Dow Man swing into action in the near future. An investor would almost be better off buying the long Treasury bond than stocks during Trump’s term, which reflects badly on his re-election prospects.
My inner investor has been cautiously positioned and underweight equities. My inner trader went short last Thursday. He took some partial profits on his short position on Friday, and he expects to reverse long early next week.
Disclosure: Long SPXU
Excellent roundup, very well done indeed.
The canary in the coal mine in the U.S. that will tell us that their economy is in BIG trouble rather than shallow is CCC junk bond spreads.
The reach for yield by investors in the last few years, has led to massive issuance of low quality corporate debt. Economic weakness will stress these issuing companies. Experts including Central Banks and the World Bank have done research and issued dire warnings about this.
Here is a chart of CCC spreads. Keep the link to check it in future. Note it’s near its year end high point which is ominous. That tells me that the new policies of the Fed to lower rates is not creating investor optimism. If the CCC spreads keep rising, the U.S. investment/economic environment is more dangerous.
https://fred.stlouisfed.org/graph/?graph_id=582384&rn=562
Also, I should also say that if the CCC spread narrows, that is very positive.
On the CCC spread chart, you can see how the spread fell VERY sharply in early January from its peak. Believers in the Canary properties would have therefore turned very confidently bullish very soon after the stock market bottom and profited.
So far, CCC spread and other financial conditions indices are still benign.
fwiw, @FZucchi is a very good follow to keep on top of credit spreads. This RealVision interview with Brian Reynolds also a must watch: https://www.youtube.com/watch?v=k9_bWbrYPKg Pension Funds are the elephant in the room in the credit markets.
Thanks Thomas, that video is a must watch. Very interesting.
The problem with these macro kind of analyses is that until they become relevant, they have no effect. Also there is distortion. So the deleveraging of the consumer in 2007 to 2009…was it healthy? No it was people walking away from mortgages and debts..that is not healthy but this is what they say about the chart now.
Then there is the trade deficit, when you have this huge deficit for years and years, the currency should depreciate, so far it has not.
Logic is good, but when the Titanic sank, it was logical to run to the highest point on the ship…but did it work?
Where will the money go? If EMs get in trouble the USD should go up, but if the US companies get into trouble first, money will go elsewhere.
You’d think the euro would go up…it is holding up in spite of negative rates, the eurozone has a trade surplus or balance…but the euro is not going up yet…basically I think we just have to see what the market does and think of the macro as warning signs
There are several issues here that you need to understand.
First, you shouldn’t just look at the trade deficit, but the current account, which includes services. The mirror image of the current account are capital flows. If you have a current account deficit, then you need capital flows into your country, and the US has the “exorbitant privilege” of being the world’s reserve currency, which helps matters. The similar tautology is also relevant to the Eurozone.
Not sure what you mean by “if the US companies get into trouble first, money will go elsewhere” in reference to EM.
About the trade deficit, they cannot go on forever. We can’t just print money, or send electrons somewhere and pay for peoples’ hard work and sweat forever. At some point it breaks….world reserve currency is also not forever. So, at some point it will break. But I think that trade balance deficits have to eventually reverse, if they don’t what happens to the currency? Right now the EMs want jobs ie exports, so they will tolerate what is going on with trade deficits, eventually (hopefully, because I wish all those people well) they will not be so desperate on exports…what happens then? Hey, could take 50 years.
The EMs comment was that if they get in trouble, they might be needing to get out of USD debt positions and this could cause a rush to buy the dollar…it’s possible.
The part about US companies and trouble is more like the CCC debt, what if that cracks first? For whatever reason….where will money go? The USD or elsewhere? I dunno, but my guess would be that some banks would have issues and QE whatever would come along and one would expect the USD to go down….but what if there was heavy positioning in anticipation of this happening and so we got a sell the news phenomenon?
So we just have to wait and see what happens lol
Cam, Just curious for how long can Wall Street continue to believe the two Tariff Man and Dow Man personas? Shouldn’t the investors realize that there is unlikely to be a deal with China, and even if there is no recession, the US economy will soften and the profits will deflate for various reasons you outlined including the strength in the USD? Is there a reason for the market to rally after the Dow persona emerges over the next few days as you expect?
I think Trump has made a fatal error.Trump is planning to force the FED to lower rates & once this is accomplished he will try to make a deal with China just in time for the election.It is my belief that China will not accept any deal prior to the election,as they would rather negotiate with a Democrat.All in all this portends a significant market sell off.I plan to liquidate positions into rallies & trade from the short side.
Correct. Trump tries shock by tweets to get markets to fall and effectively tighten the financial conditions around the world such that Powell has no choice but to cut rates. This in turn will move USD lower by markets, better than outright FX intervention, and this benefits EM countries.
By observation trump’s style of dealing with China looks like obfuscation by design. The uncertainties will no doubt influence some companies into realigning supply chains. This is US’s strategical long term move to weaken China. No matter who the next Prez is, this move will continue. Chinese CCP might think otherwise. US looks chaotic, but regarding pushing national interest, US is absolutely ruthless. See how US dealt with the previous empire the Great Britian.
It is going to be a long struggle. We better get used it. There will be no true deal with China. Even if there is one, it is just a token. Over time things get realigned and we adjust and move on.
But it looks like America will ‘move on’ without owning the global reserve currency. That is a new environment.